pertpy.tools.Mixscape
Methods table
|
Linear Discriminant Analysis on pooled CRISPR screen data. |
|
Identify perturbed and non-perturbed gRNA expressing cells that accounts for multiple treatments/conditions/chemical perturbations. |
|
Calculate perturbation signature. |
|
Barplot to visualize perturbation scores calculated by the mixscape function. |
|
Heatmap plot using mixscape results. |
|
Visualizing perturbation responses with Linear Discriminant Analysis. |
|
Density plots to visualize perturbation scores calculated by the pt.tl.mixscape function. |
|
Violin plot using mixscape results. |
Methods
lda
- Mixscape.lda(adata, labels, control, mixscape_class_global='mixscape_class_global', layer=None, n_comps=10, min_de_genes=5, logfc_threshold=0.25, split_by=None, pval_cutoff=0.05, perturbation_type='KO', copy=False)[source]
Linear Discriminant Analysis on pooled CRISPR screen data. Requires pt.tl.mixscape() to be run first.
- Parameters:
adata (
AnnData) – The annotated data object.labels (
str) – The column of .obs with target gene labels.control (
str) – Control category from the pert_key column.mixscape_class_global (
str|None) – The column of .obs with mixscape global classification result (perturbed, NP or NT).layer (
str|None) – Key from adata.layers whose value will be used to perform tests on.control – Control category from the pert_key column. Defaults to ‘NT’.
n_comps (
int|None) – Number of principal components to use. Defaults to 10.min_de_genes (
int|None) – Required number of genes that are differentially expressed for method to separate perturbed and non-perturbed cells.logfc_threshold (
float|None) – Limit testing to genes which show, on average, at least X-fold difference (log-scale) between the two groups of cells. Defaults to 0.25.split_by (
str|None) – Provide the column .obs if multiple biological replicates exist to calculatepval_cutoff (
float|None) – P-value cut-off for selection of significantly DE genes.perturbation_type (
str|None) – Specify type of CRISPR perturbation expected for labeling mixscape classifications. Defaults to KO.copy (
bool|None) – Determines whether a copy of the adata is returned.
- Returns:
If copy=True, returns the copy of adata with the LDA result in .uns. Otherwise, writes the results directly to .uns of the provided adata.
mixscape_lda: numpy.ndarray (adata.uns[‘mixscape_lda’]). LDA result.
Examples
Use LDA dimensionality reduction to visualize the perturbation effects:
>>> import pertpy as pt
>>> mdata = pt.dt.papalexi_2021()
>>> ms_pt = pt.tl.Mixscape()
>>> ms_pt.perturbation_signature(mdata["rna"], "perturbation", "NT", "replicate")
>>> ms_pt.mixscape(adata=mdata["rna"], control="NT", labels="gene_target", layer="X_pert")
>>> ms_pt.lda(adata=mdata["rna"], control="NT", labels="gene_target", layer="X_pert")
mixscape
- Mixscape.mixscape(adata, labels, control, new_class_name='mixscape_class', min_de_genes=5, layer=None, logfc_threshold=0.25, iter_num=10, split_by=None, pval_cutoff=0.05, perturbation_type='KO', copy=False)[source]
Identify perturbed and non-perturbed gRNA expressing cells that accounts for multiple treatments/conditions/chemical perturbations.
The implementation resembles https://satijalab.org/seurat/reference/runmixscape
- Parameters:
adata (
AnnData) – The annotated data object.labels (
str) – The column of .obs with target gene labels.control (
str) – Control category from the pert_key column.new_class_name (
str|None) – Name of mixscape classification to be stored in .obs.min_de_genes (
int|None) – Required number of genes that are differentially expressed for method to separate perturbed and non-perturbed cells.layer (
str|None) – Key from adata.layers whose value will be used to perform tests on. Default is using .layers[“X_pert”].logfc_threshold (
float|None) – Limit testing to genes which show, on average, at least X-fold difference (log-scale) between the two groups of cells (default: 0.25).iter_num (
int|None) – Number of normalmixEM iterations to run if convergence does not occur.split_by (
str|None) – Provide the column .obs if multiple biological replicates exist to calculate the perturbation signature for every replicate separately.pval_cutoff (
float|None) – P-value cut-off for selection of significantly DE genes.perturbation_type (
str|None) – specify type of CRISPR perturbation expected for labeling mixscape classifications. Defaults to KO.copy (
bool|None) – Determines whether a copy of the adata is returned.
- Returns:
If copy=True, returns the copy of adata with the classification result in .obs. Otherwise, writes the results directly to .obs of the provided adata.
mixscape_class: pandas.Series (adata.obs[‘mixscape_class’]). Classification result with cells being either classified as perturbed (KO, by default) or non-perturbed (NP) based on their target gene class.
mixscape_class_global: pandas.Series (adata.obs[‘mixscape_class_global’]). Global classification result (perturbed, NP or NT).
mixscape_class_p_ko: pandas.Series (adata.obs[‘mixscape_class_p_ko’]). Posterior probabilities used to determine if a cell is KO (default). Name of this item will change to match perturbation_type parameter setting. (>0.5) or NP.
Examples
Calcutate perturbation signature for each cell in the dataset:
>>> import pertpy as pt
>>> mdata = pt.dt.papalexi_2021()
>>> ms_pt = pt.tl.Mixscape()
>>> ms_pt.perturbation_signature(mdata["rna"], "perturbation", "NT", "replicate")
>>> ms_pt.mixscape(adata=mdata["rna"], control="NT", labels="gene_target", layer="X_pert")
perturbation_signature
- Mixscape.perturbation_signature(adata, pert_key, control, split_by=None, n_neighbors=20, use_rep=None, n_pcs=None, batch_size=None, copy=False, **kwargs)[source]
Calculate perturbation signature.
For each cell, we identify n_neighbors cells from the control pool with the most similar mRNA expression profiles. The perturbation signature is calculated by subtracting the averaged mRNA expression profile of the control neighbors from the mRNA expression profile of each cell.
- Parameters:
adata (
AnnData) – The annotated data object.pert_key (
str) – The column of .obs with perturbation categories, should also contain control.control (
str) – Control category from the pert_key column.split_by (
str|None) – Provide the column .obs if multiple biological replicates exist to calculate the perturbation signature for every replicate separately.n_neighbors (
int) – Number of neighbors from the control to use for the perturbation signature.use_rep (
str|None) – Use the indicated representation. ‘X’ or any key for .obsm is valid. If None, the representation is chosen automatically: For .n_vars < 50, .X is used, otherwise ‘X_pca’ is used. If ‘X_pca’ is not present, it’s computed with default parameters.n_pcs (
int|None) – Use this many PCs. If n_pcs==0 use .X if use_rep is None.batch_size (
int|None) – Size of batch to calculate the perturbation signature. If ‘None’, the perturbation signature is calcuated in the full mode, requiring more memory. The batched mode is very inefficient for sparse data.copy (
bool) – Determines whether a copy of the adata is returned.**kwargs – Additional arguments for the NNDescent class from pynndescent.
- Returns:
If copy=True, returns the copy of adata with the perturbation signature in .layers[“X_pert”]. Otherwise, writes the perturbation signature directly to .layers[“X_pert”] of the provided adata.
Examples
Calcutate perturbation signature for each cell in the dataset:
>>> import pertpy as pt
>>> mdata = pt.dt.papalexi_2021()
>>> ms_pt = pt.tl.Mixscape()
>>> ms_pt.perturbation_signature(mdata["rna"], "perturbation", "NT", "replicate")
plot_barplot
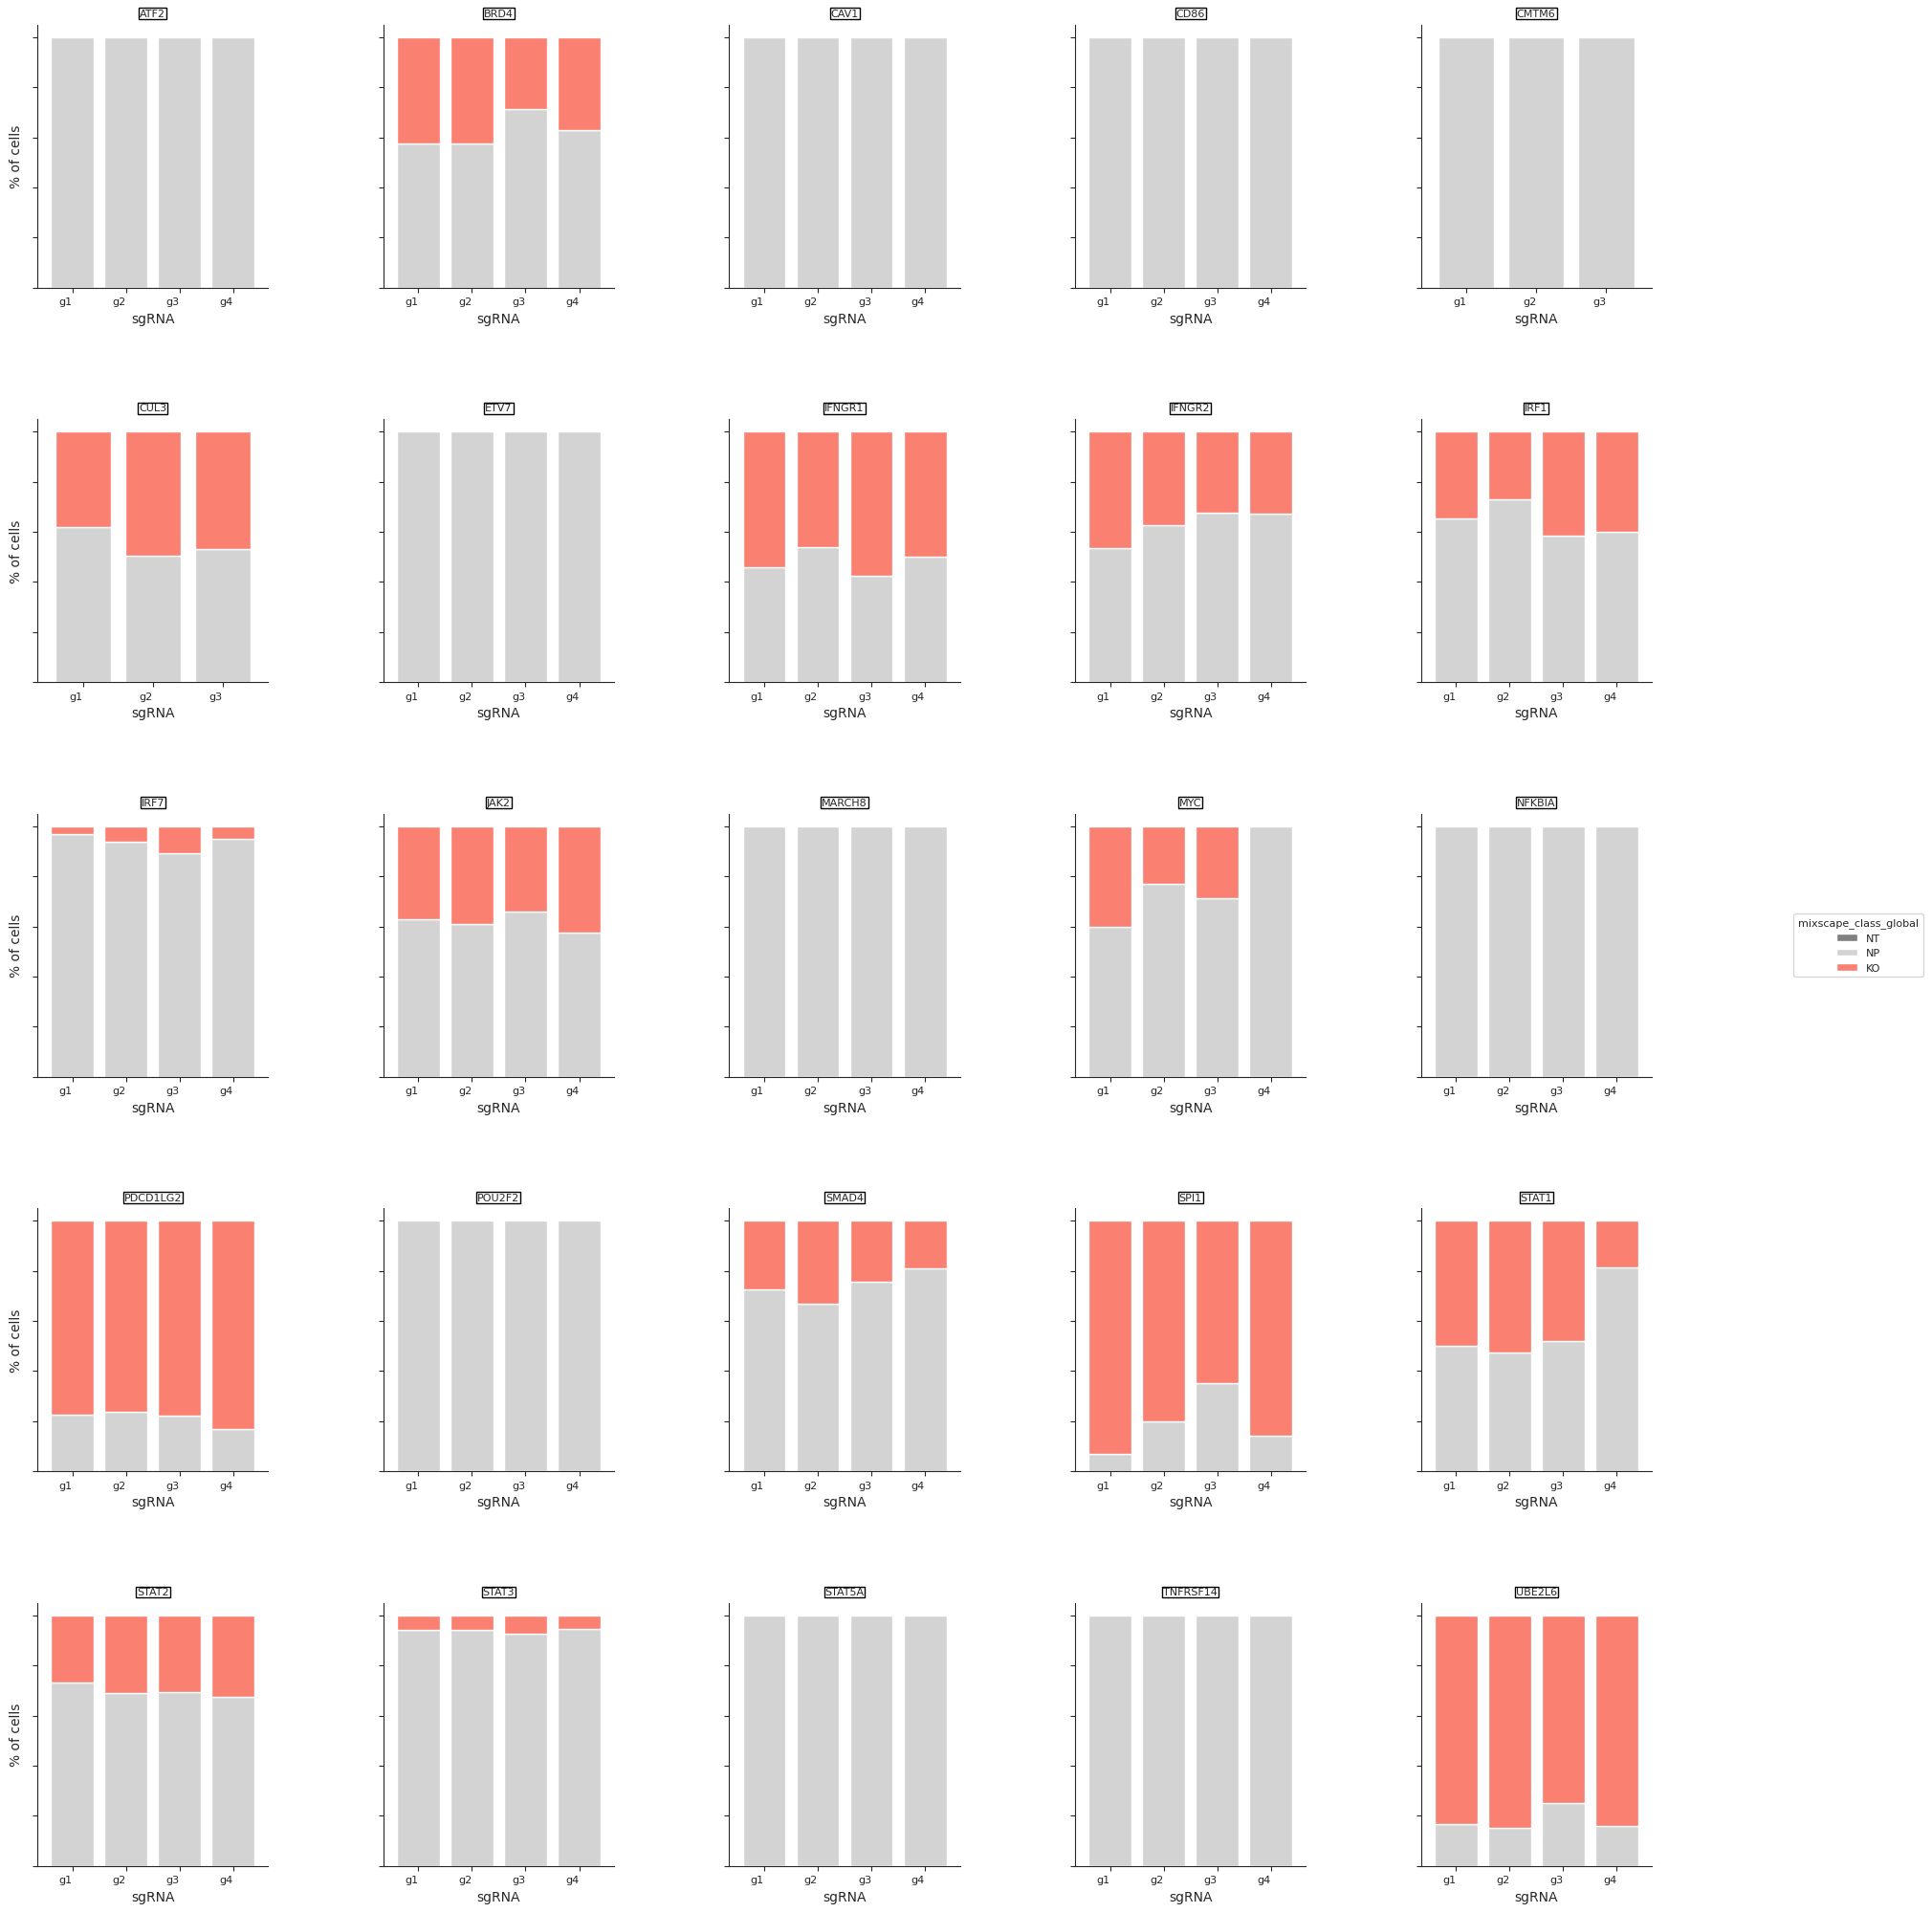
- Mixscape.plot_barplot(adata, guide_rna_column, mixscape_class_global='mixscape_class_global', axis_text_x_size=8, axis_text_y_size=6, axis_title_size=8, legend_title_size=8, legend_text_size=8, return_fig=None, ax=None, show=None, save=None)[source]
Barplot to visualize perturbation scores calculated by the mixscape function.
- Parameters:
adata (
AnnData) – The annotated data object.guide_rna_column (
str) – The column of .obs with guide RNA labels. The target gene labels. The format must be <gene_target>g<#>. Examples are ‘STAT2g1’ and ‘ATF2g1’.mixscape_class_global (
str) – The column of .obs with mixscape global classification result (perturbed, NP or NT).save (
bool|str|None) – If True or a str, save the figure. A string is appended to the default filename. Infer the filetype if ending on {‘.pdf’, ‘.png’, ‘.svg’}.
- Returns:
class:`~matplotlib.axes.Axes.
- Return type:
If show==False, return a
Examples
>>> import pertpy as pt
>>> mdata = pt.dt.papalexi_2021()
>>> ms_pt = pt.tl.Mixscape()
>>> ms_pt.perturbation_signature(mdata["rna"], "perturbation", "NT", "replicate")
>>> ms_pt.mixscape(adata=mdata["rna"], control="NT", labels="gene_target", layer="X_pert")
>>> ms_pt.plot_barplot(mdata["rna"], guide_rna_column="NT")
- Preview:
plot_heatmap
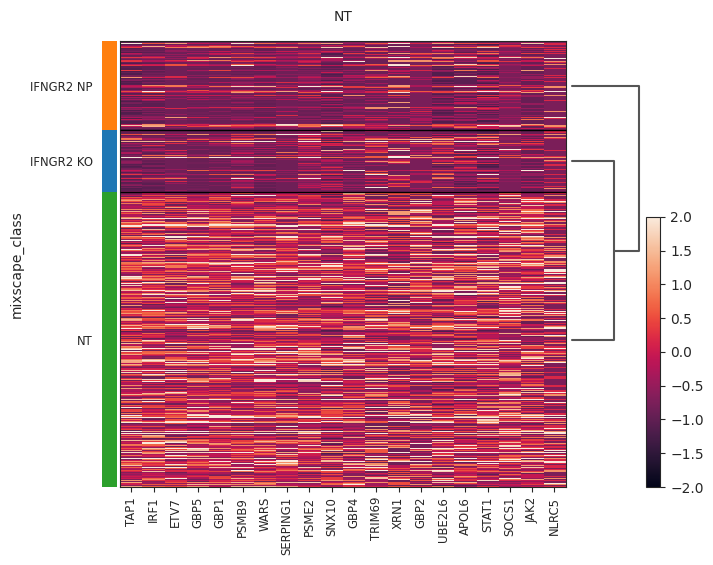
- Mixscape.plot_heatmap(adata, labels, target_gene, control, layer=None, method='wilcoxon', subsample_number=900, vmin=-2, vmax=2, return_fig=None, show=None, save=None, **kwds)[source]
Heatmap plot using mixscape results. Requires pt.tl.mixscape() to be run first.
- Parameters:
adata (
AnnData) – The annotated data object.labels (
str) – The column of .obs with target gene labels.target_gene (
str) – Target gene name to visualize heatmap for.control (
str) – Control category from the pert_key column.layer (
str|None) – Key from adata.layers whose value will be used to perform tests on.method (
str|None) – The default method is ‘wilcoxon’, see method parameter in scanpy.tl.rank_genes_groups for more options.subsample_number (
int|None) – Subsample to this number of observations.vmin (
float|None) – The value representing the lower limit of the color scale. Values smaller than vmin are plotted with the same color as vmin.vmax (
float|None) – The value representing the upper limit of the color scale. Values larger than vmax are plotted with the same color as vmax.save (
bool|str|None) – If True or a str, save the figure. A string is appended to the default filename. Infer the filetype if ending on {‘.pdf’, ‘.png’, ‘.svg’}.ax – A matplotlib axes object. Only works if plotting a single component.
**kwds – Additional arguments to scanpy.pl.rank_genes_groups_heatmap.
- Return type:
- Returns:
If show==False, return a
Axes.
Examples
>>> import pertpy as pt
>>> mdata = pt.dt.papalexi_2021()
>>> ms_pt = pt.tl.Mixscape()
>>> ms_pt.perturbation_signature(mdata["rna"], "perturbation", "NT", "replicate")
>>> ms_pt.mixscape(adata=mdata["rna"], control="NT", labels="gene_target", layer="X_pert")
>>> ms_pt.plot_heatmap(
...     adata=mdata["rna"], labels="gene_target", target_gene="IFNGR2", layer="X_pert", control="NT"
... )
- Preview:
plot_lda
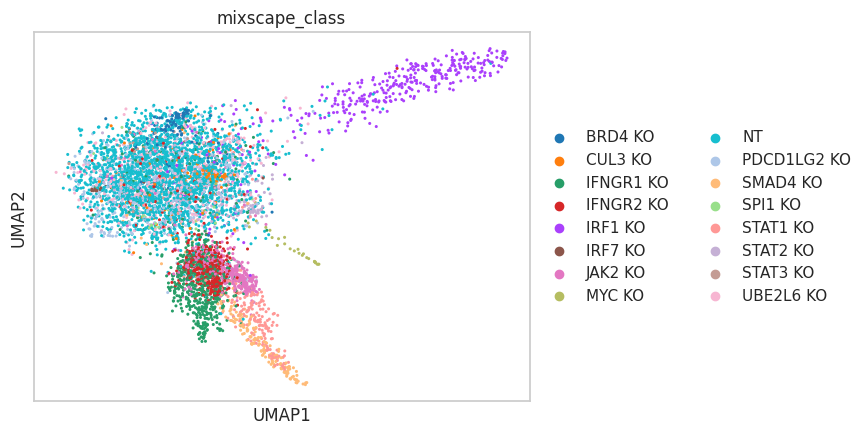
- Mixscape.plot_lda(adata, control, mixscape_class='mixscape_class', mixscape_class_global='mixscape_class_global', perturbation_type='KO', lda_key='mixscape_lda', n_components=None, color_map=None, palette=None, return_fig=None, ax=None, show=None, save=None, **kwds)[source]
Visualizing perturbation responses with Linear Discriminant Analysis. Requires pt.tl.mixscape() to be run first.
- Parameters:
adata (
AnnData) – The annotated data object.control (
str) – Control category from the pert_key column.mixscape_class (
str) – The column of .obs with the mixscape classification result.mixscape_class_global (
str) – The column of .obs with mixscape global classification result (perturbed, NP or NT).perturbation_type (
str|None) – Specify type of CRISPR perturbation expected for labeling mixscape classifications. Defaults to ‘KO’.lda_key (
str|None) – If not specified, lda looks .uns[“mixscape_lda”] for the LDA results.n_components (
int|None) – The number of dimensions of the embedding.save (
bool|str|None) – If True or a str, save the figure. A string is appended to the default filename. Infer the filetype if ending on {‘.pdf’, ‘.png’, ‘.svg’}.**kwds – Additional arguments to scanpy.pl.umap.
- Return type:
Examples
>>> import pertpy as pt
>>> mdata = pt.dt.papalexi_2021()
>>> ms_pt = pt.tl.Mixscape()
>>> ms_pt.perturbation_signature(mdata["rna"], "perturbation", "NT", "replicate")
>>> ms_pt.mixscape(adata=mdata["rna"], control="NT", labels="gene_target", layer="X_pert")
>>> ms_pt.lda(adata=mdata["rna"], control="NT", labels="gene_target", layer="X_pert")
>>> ms_pt.plot_lda(adata=mdata["rna"], control="NT")
- Preview:
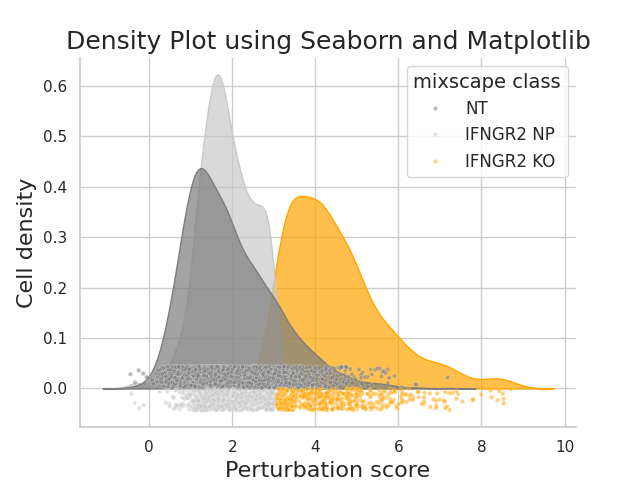
plot_perturbscore
- Mixscape.plot_perturbscore(adata, labels, target_gene, mixscape_class='mixscape_class', color='orange', palette=None, split_by=None, before_mixscape=False, perturbation_type='KO', return_fig=None, ax=None, show=None, save=None)[source]
Density plots to visualize perturbation scores calculated by the pt.tl.mixscape function.
Requires pt.tl.mixscape to be run first.
https://satijalab.org/seurat/reference/plotperturbscore
- Parameters:
adata (
AnnData) – The annotated data object.labels (
str) – The column of .obs with target gene labels.target_gene (
str) – Target gene name to visualize perturbation scores for.mixscape_class (
str) – The column of .obs with mixscape classifications.color (
str) – Specify color of target gene class or knockout cell class. For control non-targeting and non-perturbed cells, colors are set to different shades of grey.palette (
dict[str,str]) – Optional full color palette to overwrite all colors.split_by (
str) – Provide the column .obs if multiple biological replicates exist to calculate the perturbation signature for every replicate separately.before_mixscape (
bool) – Option to split densities based on mixscape classification (default) or original target gene classification. Default is set to NULL and plots cells by original class ID.perturbation_type (
str) – Specify type of CRISPR perturbation expected for labeling mixscape classifications. Defaults to KO.
- Return type:
Examples
Visualizing the perturbation scores for the cells in a dataset:
>>> import pertpy as pt
>>> mdata = pt.dt.papalexi_2021()
>>> ms_pt = pt.tl.Mixscape()
>>> ms_pt.perturbation_signature(mdata["rna"], "perturbation", "NT", "replicate")
>>> ms_pt.mixscape(adata=mdata["rna"], control="NT", labels="gene_target", layer="X_pert")
>>> ms_pt.plot_perturbscore(adata=mdata["rna"], labels="gene_target", target_gene="IFNGR2", color="orange")
- Preview:
plot_violin
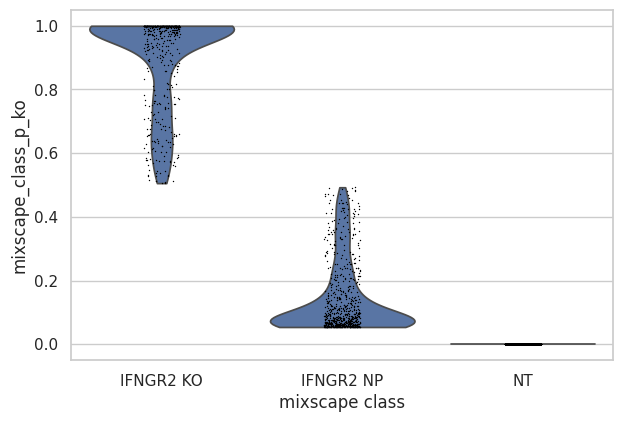
- Mixscape.plot_violin(adata, target_gene_idents, keys='mixscape_class_p_ko', groupby='mixscape_class', log=False, use_raw=None, stripplot=True, hue=None, jitter=True, size=1, layer=None, scale='width', order=None, multi_panel=None, xlabel='', ylabel=None, rotation=None, ax=None, show=None, save=None, **kwargs)[source]
Violin plot using mixscape results.
Requires pt.tl.mixscape to be run first.
- Parameters:
adata (
AnnData) – The annotated data object.target_gene_idents (
str|list[str]) – Target gene name to plot.keys (
str|Sequence[str]) – Keys for accessing variables of .var_names or fields of .obs. Default is ‘mixscape_class_p_ko’.groupby (
str|None) – The key of the observation grouping to consider. Default is ‘mixscape_class’.log (
bool) – Plot on logarithmic axis.use_raw (
bool|None) – Whether to use raw attribute of adata. Defaults to True if .raw is present.stripplot (
bool) – Add a stripplot on top of the violin plot.order (
Sequence[str] |None) – Order in which to show the categories.xlabel (
str) – Label of the x-axis. Defaults to groupby if rotation is None, otherwise, no label is shown.ylabel (
str|Sequence[str] |None) – Label of the y-axis. If None and groupby is None, defaults to ‘value’. If None and groubpy is not None, defaults to keys.save (
bool|str|None) – If True or a str, save the figure. A string is appended to the default filename. Infer the filetype if ending on {‘.pdf’, ‘.png’, ‘.svg’}.ax (
Axes|None) – A matplotlib axes object. Only works if plotting a single component.**kwargs – Additional arguments to seaborn.violinplot.
- Returns:
A
Axesobject if ax is None else None.
Examples
>>> import pertpy as pt
>>> mdata = pt.dt.papalexi_2021()
>>> ms_pt = pt.tl.Mixscape()
>>> ms_pt.perturbation_signature(mdata["rna"], "perturbation", "NT", "replicate")
>>> ms_pt.mixscape(adata=mdata["rna"], control="NT", labels="gene_target", layer="X_pert")
>>> ms_pt.plot_violin(
...     adata=mdata["rna"], target_gene_idents=["NT", "IFNGR2 NP", "IFNGR2 KO"], groupby="mixscape_class"
... )
- Preview: