pertpy.tools.Augur
Methods table
|
Calculate average metric of cross validation runs done of one cell type. |
|
Implementation of Lin's Concordance correlation coefficient, based on https://gitlab.com/-/snippets/1730605. |
|
Cox compare test on two models. |
|
Creates a model object of the provided type and populates it with desired parameters. |
|
Cross validate subsample anndata object. |
|
Subsample and select random features of anndata object. |
|
Loads the input data. |
|
Calculates the Area under the Curve using the given classifier. |
|
Predicts the differential prioritization by performing permutation tests on samples. |
|
Perform cross validation on given subsample. |
|
Sample AnnData observations. |
|
Feature selection by variance using scanpy highly variable genes function. |
|
Feature selection based on Augur implementation. |
|
Set scoring fuctions for cross-validation based on estimator. |
|
Plot scatterplot of differential prioritization. |
|
Plot a lollipop plot of the n features with largest feature importances. |
|
Plot a lollipop plot of the mean augur values. |
|
Create scatterplot with two augur results. |
Methods
average_metrics
ccc_score
- Augur.ccc_score(y_true, y_pred)[source]
Implementation of Lin’s Concordance correlation coefficient, based on https://gitlab.com/-/snippets/1730605.
- Parameters:
y_true – array-like of shape (n_samples), ground truth (correct) target values
y_pred – array-like of shape (n_samples), estimated target values
- Return type:
- Returns:
Concordance correlation coefficient.
cox_compare
- Augur.cox_compare(loess1, loess2)[source]
Cox compare test on two models.
Based on: https://www.statsmodels.org/dev/generated/statsmodels.stats.diagnostic.compare_cox.html Info: Tests of non-nested hypothesis might not provide unambiguous answers. The test should be performed in both directions and it is possible that both or neither test rejects.
- Parameters:
loess1 – fitted loess regression object
loess2 – fitted loess regression object
- Returns:
t-statistic for the test that including the fitted values of the first model in the second model has no effect and two-sided pvalue for the t-statistic
create_estimator
- Augur.create_estimator(classifier, params=None)[source]
Creates a model object of the provided type and populates it with desired parameters.
- Parameters:
classifier (
Union[Literal['random_forest_classifier'],Literal['random_forest_regressor'],Literal['logistic_regression_classifier']]) – classifier to use in calculating the area under the curve. Either random forest classifier or logistic regression for categorical data or random forest regressor for continous dataparams (
Params|None) – parameters used to populate the model object. Default values are n_estimators = 100, max_depth = None, max_features = 2, penalty = l2, random_state = None.
- Return type:
RandomForestClassifier|RandomForestRegressor|LogisticRegression- Returns:
Estimator object.
Examples
>>> import pertpy as pt
>>> augur = pt.tl.Augur("random_forest_classifier")
>>> estimator = augur.create_estimator("logistic_regression_classifier")
cross_validate_subsample
- Augur.cross_validate_subsample(adata, augur_mode, subsample_size, folds, feature_perc, subsample_idx, random_state, zero_division)[source]
Cross validate subsample anndata object.
- Parameters:
adata (
AnnData) – Anndata with obs label and cell_type for label and cell type and dummie variable y_ columns used as targetaugur_mode (
str) – one of default, velocity or permute. Setting augur_mode = “velocity” disables feature selection, assuming feature selection has been performed by the RNA velocity procedure to produce the input matrix, while setting augur_mode = “permute” will generate a null distribution of AUCs for each cell type by permuting the labelssubsample_size (
int) – number of cells to subsample randomly per type from each experimental conditionfolds (
int) – number of folds to run cross validation onfeature_perc (
float) – proportion of genes that are randomly selected as features for input to the classifier in each subsample using the random gene filtersubsample_idx (
int) – index of the subsamplerandom_state (
int|None) – set numpy random seed, sampling seed and fold seedzero_division (
int|str) – 0 or 1 or warn; Sets the value to return when there is a zero division. If set to “warn”, this acts as 0, but warnings are also raised. Precision metric parameter.
- Return type:
- Returns:
Results for each cross validation fold.
Examples
>>> import pertpy as pt
>>> adata = pt.dt.sc_sim_augur()
>>> ag_rfc = pt.tl.Augur("random_forest_classifier")
>>> loaded_data = ag_rfc.load(adata)
>>> ag_rfc.select_highly_variable(loaded_data)
>>> results = ag_rfc.cross_validate_subsample(loaded_data, augur_mode="default", subsample_size=20,                 folds=3, feature_perc=0.5, subsample_idx=0, random_state=42, zero_division=0)
draw_subsample
- Augur.draw_subsample(adata, augur_mode, subsample_size, feature_perc, categorical, random_state)[source]
Subsample and select random features of anndata object.
- Parameters:
adata (
AnnData) – Anndata with obs label and cell_type for label and cell type and dummie variable y_ columns used as targetaugur_mode (
str) – one of default, velocity or permute. Setting augur_mode = “velocity” disables feature selection, assuming feature selection has been performed by the RNA velocity procedure to produce the input matrix, while setting augur_mode = “permute” will generate a null distribution of AUCs for each cell type by permuting the labelssubsample_size (
int) – number of cells to subsample randomly per type from each experimental conditionfeature_perc (
float) – proportion of genes that are randomly selected as features for input to the classifier in each subsample using the random gene filtercategorical (
bool) – True if target values are categoricalrandom_state (
int) – set numpy random seed and sampling seed
- Return type:
- Returns:
Subsample of anndata object of size subsample_size
Examples
>>> import pertpy as pt
>>> adata = pt.dt.sc_sim_augur()
>>> ag_rfc = pt.tl.Augur("random_forest_classifier")
>>> loaded_data = ag_rfc.load(adata)
>>> ag_rfc.select_highly_variable(loaded_data)
>>> subsample = ag_rfc.draw_subsample(adata, augur_mode="default", subsample_size=20, feature_perc=0.5,                 categorical=True, random_state=42)
load
- Augur.load(input, meta=None, label_col='label_col', cell_type_col='cell_type_col', condition_label=None, treatment_label=None)[source]
Loads the input data.
- Parameters:
input (
AnnData|DataFrame) – Anndata or matrix containing gene expression values (genes in rows, cells in columns) and optionally meta data about each cell.meta (
DataFrame|None) – Optional Pandas DataFrame containing meta data about each cell.label_col (
str) – column of the meta DataFrame or the Anndata or matrix containing the condition labels for each cell in the cell-by-gene expression matrixcell_type_col (
str) – column of the meta DataFrame or the Anndata or matrix containing the cell type labels for each cell in the cell-by-gene expression matrixcondition_label (
str|None) – in the case of more than two labels, this label is used in the analysistreatment_label (
str|None) – in the case of more than two labels, this label is used in the analysis
- Return type:
- Returns:
Anndata object containing gene expression values (cells in rows, genes in columns) and cell type, label and y dummy variables as obs
Examples
>>> import pertpy as pt
>>> adata = pt.dt.sc_sim_augur()
>>> ag_rfc = pt.tl.Augur("random_forest_classifier")
>>> loaded_data = ag_rfc.load(adata)
plot_dp_scatter
- Augur.plot_dp_scatter(results, top_n=None, return_fig=None, ax=None, show=None, save=None)[source]
Plot scatterplot of differential prioritization.
- Parameters:
- Return type:
- Returns:
Axes of the plot.
Examples
>>> import pertpy as pt
>>> adata = pt.dt.bhattacherjee()
>>> ag_rfc = pt.tl.Augur("random_forest_classifier")
>>> data_15 = ag_rfc.load(adata, condition_label="Maintenance_Cocaine", treatment_label="withdraw_15d_Cocaine")
>>> adata_15, results_15 = ag_rfc.predict(data_15, random_state=None, n_threads=4)
>>> adata_15_permute, results_15_permute = ag_rfc.predict(data_15, augur_mode="permute", n_subsamples=100, random_state=None, n_threads=4)
>>> data_48 = ag_rfc.load(adata, condition_label="Maintenance_Cocaine", treatment_label="withdraw_48h_Cocaine")
>>> adata_48, results_48 = ag_rfc.predict(data_48, random_state=None, n_threads=4)
>>> adata_48_permute, results_48_permute = ag_rfc.predict(data_48, augur_mode="permute", n_subsamples=100, random_state=None, n_threads=4)
>>> pvals = ag_rfc.predict_differential_prioritization(augur_results1=results_15, augur_results2=results_48,                 permuted_results1=results_15_permute, permuted_results2=results_48_permute)
>>> ag_rfc.plot_dp_scatter(pvals)
- Preview:
plot_important_features
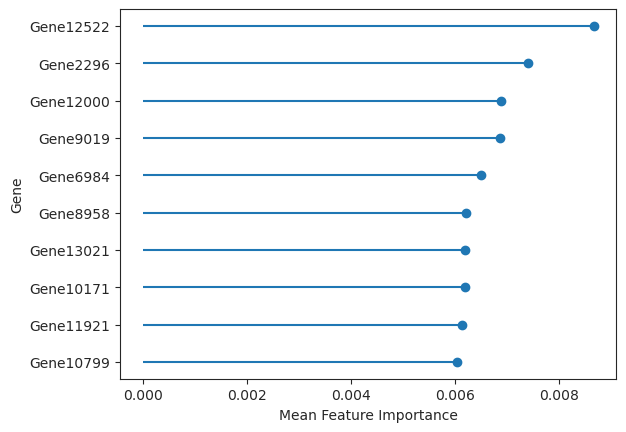
- Augur.plot_important_features(data, key='augurpy_results', top_n=10, return_fig=None, ax=None, show=None, save=None)[source]
Plot a lollipop plot of the n features with largest feature importances.
- Parameters:
results – results after running predict() as dictionary or the AnnData object.
key (
str) – Key in the AnnData object of the resultstop_n (
int) – n number feature importance values to plot. Default is 10.ax (
Axes) – optionally, axes used to draw plotreturn_figure – if True returns figure of the plot, default is False
- Return type:
- Returns:
Axes of the plot.
Examples
>>> import pertpy as pt
>>> adata = pt.dt.sc_sim_augur()
>>> ag_rfc = pt.tl.Augur("random_forest_classifier")
>>> loaded_data = ag_rfc.load(adata)
>>> v_adata, v_results = ag_rfc.predict(
...     loaded_data, subsample_size=20, select_variance_features=True, n_threads=4
... )
>>> ag_rfc.plot_important_features(v_results)
- Preview:
plot_lollipop
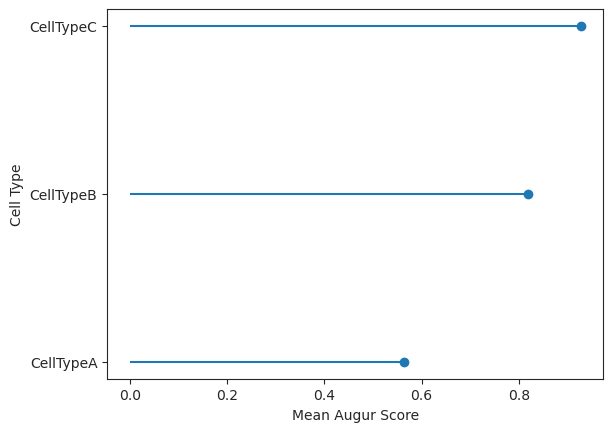
- Augur.plot_lollipop(data, key='augurpy_results', return_fig=None, ax=None, show=None, save=None)[source]
Plot a lollipop plot of the mean augur values.
- Parameters:
- Return type:
- Returns:
Axes of the plot.
Examples
>>> import pertpy as pt
>>> adata = pt.dt.sc_sim_augur()
>>> ag_rfc = pt.tl.Augur("random_forest_classifier")
>>> loaded_data = ag_rfc.load(adata)
>>> v_adata, v_results = ag_rfc.predict(
...     loaded_data, subsample_size=20, select_variance_features=True, n_threads=4
... )
>>> ag_rfc.plot_lollipop(v_results)
- Preview:
plot_scatterplot
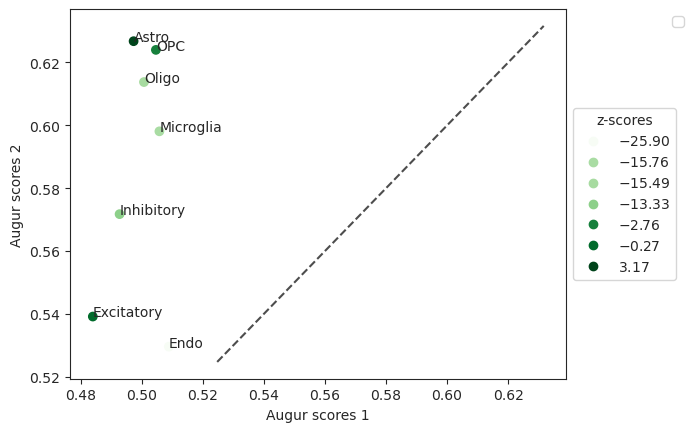
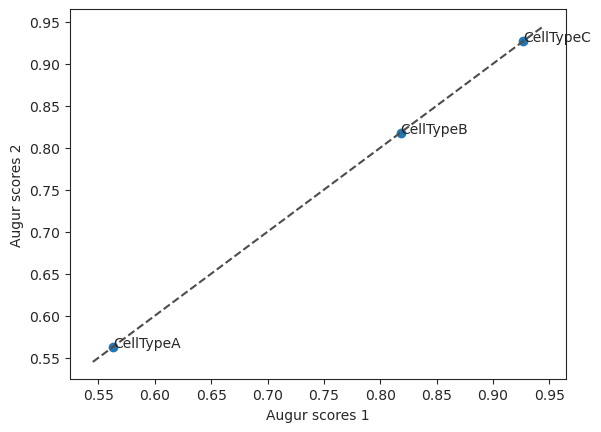
- Augur.plot_scatterplot(results1, results2, top_n=None, return_fig=None, show=None, save=None)[source]
Create scatterplot with two augur results.
- Parameters:
- Return type:
- Returns:
Axes of the plot.
Examples
>>> import pertpy as pt
>>> adata = pt.dt.sc_sim_augur()
>>> ag_rfc = pt.tl.Augur("random_forest_classifier")
>>> loaded_data = ag_rfc.load(adata)
>>> h_adata, h_results = ag_rfc.predict(loaded_data, subsample_size=20, n_threads=4)
>>> v_adata, v_results = ag_rfc.predict(
...     loaded_data, subsample_size=20, select_variance_features=True, n_threads=4
... )
>>> ag_rfc.plot_scatterplot(v_results, h_results)
- Preview:
predict
- Augur.predict(adata, n_subsamples=50, subsample_size=20, folds=3, min_cells=None, feature_perc=0.5, var_quantile=0.5, span=0.75, filter_negative_residuals=False, n_threads=4, augur_mode='default', select_variance_features=True, key_added='augurpy_results', random_state=None, zero_division=0)[source]
Calculates the Area under the Curve using the given classifier.
- Parameters:
adata (
AnnData) – Anndata with obs label and cell_type for label and cell type and dummie variable y_ columns used as targetn_subsamples (
int) – number of random subsamples to draw from complete dataset for each cell typesubsample_size (
int) – number of cells to subsample randomly per type from each experimental conditionfolds (
int) – number of folds to run cross validation on. Be careful changing this parameter without also changing subsample_size.min_cells (
int) – minimum number of cells for a particular cell type in each condition in order to retain that type for analysis (depricated..)feature_perc (
float) – proportion of genes that are randomly selected as features for input to the classifier in each subsample using the random gene filtervar_quantile (
float) – The quantile below which features will be filtered, based on their residuals in a loess model. Defaults to 0.5.span (
float) – Smoothing factor, as a fraction of the number of points to take into account. Should be in the range (0, 1]. Defaults to 0.75.filter_negative_residuals (
bool) – if True, filter residuals at a fixed threshold of zero, instead of var_quantilen_threads (
int) – number of threads to use for parallelizationselect_variance_features (
bool) – Whether to select genes based on the original Augur implementation (True) or using scanpy’s highly_variable_genes (False). Defaults to True.key_added (
str) – Key to add results to in .unsaugur_mode (
Union[Literal['permute'],Literal['default'],Literal['velocity']]) – One of ‘default’, ‘velocity’ or ‘permute’. Setting augur_mode = “velocity” disables feature selection, assuming feature selection has been performed by the RNA velocity procedure to produce the input matrix, while setting augur_mode = “permute” will generate a null distribution of AUCs for each cell type by permuting the labels. Note that when setting augur_mode = “permute” n_subsample values less than 100 will be set to 500.random_state (
int|None) – set numpy random seed, sampling seed and fold seedzero_division (
int|str) – 0 or 1 or warn; Sets the value to return when there is a zero division. If set to “warn”, this acts as 0, but warnings are also raised. Precision metric parameter.
- Returns:
summary_metrics: Pandas Dataframe containing mean metrics for each cell type
feature_importances: Pandas Dataframe containing feature importances of genes across all cross validation runs
full_results: Dict containing merged results of individual cross validation runs for each cell type
[cell_types]: Cross validation runs of the cell type called
- Return type:
A tuple with a dictionary containing the following keys with an updated AnnData object with mean_augur_score metrics in obs
Examples
>>> import pertpy as pt
>>> adata = pt.dt.sc_sim_augur()
>>> ag_rfc = pt.tl.Augur("random_forest_classifier")
>>> loaded_data = ag_rfc.load(adata)
>>> h_adata, h_results = ag_rfc.predict(loaded_data, subsample_size=20, n_threads=4)
predict_differential_prioritization
- Augur.predict_differential_prioritization(augur_results1, augur_results2, permuted_results1, permuted_results2, n_subsamples=50, n_permutations=1000)[source]
Predicts the differential prioritization by performing permutation tests on samples.
Performs permutation tests that identifies cell types with statistically significant differences in augur_score between two conditions respectively compared to the control.
- Parameters:
augur1 – Augurpy results from condition 1, obtained from predict()[1]
augur2 – Augurpy results from condition 2, obtained from predict()[1]
permuted1 – permuted Augurpy results from condition 1, obtained from predict() with argument augur_mode=permute
permuted2 – permuted Augurpy results from condition 2, obtained from predict() with argument augur_mode=permute
n_subsamples (
int) – number of subsamples to pool when calculating the mean augur score for each permutation; Defaults to 50.n_permutations (
int) – the total number of mean augur scores to calculate from a background distribution
- Return type:
- Returns:
Results object containing mean augur scores.
Examples
>>> import pertpy as pt
>>> adata = pt.dt.bhattacherjee()
>>> ag_rfc = pt.tl.Augur("random_forest_classifier")
>>> data_15 = ag_rfc.load(adata, condition_label="Maintenance_Cocaine", treatment_label="withdraw_15d_Cocaine")
>>> adata_15, results_15 = ag_rfc.predict(data_15, random_state=None, n_threads=4)
>>> adata_15_permute, results_15_permute = ag_rfc.predict(data_15, augur_mode="permute", n_subsamples=100, random_state=None, n_threads=4)
>>> data_48 = ag_rfc.load(adata, condition_label="Maintenance_Cocaine", treatment_label="withdraw_48h_Cocaine")
>>> adata_48, results_48 = ag_rfc.predict(data_48, random_state=None, n_threads=4)
>>> adata_48_permute, results_48_permute = ag_rfc.predict(data_48, augur_mode="permute", n_subsamples=100, random_state=None, n_threads=4)
>>> pvals = ag_rfc.predict_differential_prioritization(augur_results1=results_15, augur_results2=results_48, permuted_results1=results_15_permute, permuted_results2=results_48_permute)
run_cross_validation
- Augur.run_cross_validation(subsample, subsample_idx, folds, random_state, zero_division)[source]
Perform cross validation on given subsample.
- Parameters:
subsample (
AnnData) – subsample of gene expression matrix of size subsample_sizeestimator – classifier object to use in calculating the area under the curve
subsample_idx (
int) – index of subsamplefolds (
int) – number of foldszero_division (
int|str) – 0 or 1 or warn; Sets the value to return when there is a zero division. If set to “warn”, this acts as 0, but warnings are also raised. Precision metric parameter.
- Return type:
- Returns:
Dictionary containing prediction metrics and estimator for each fold.
Examples
>>> import pertpy as pt
>>> adata = pt.dt.sc_sim_augur()
>>> ag_rfc = pt.tl.Augur("random_forest_classifier")
>>> loaded_data = ag_rfc.load(adata)
>>> ag_rfc.select_highly_variable(loaded_data)
>>> subsample = ag_rfc.draw_subsample(adata, augur_mode="default", subsample_size=20, feature_perc=0.5,                 categorical=True, random_state=42)
>>> results = ag_rfc.run_cross_validation(subsample=subsample, folds=3, subsample_idx=0, random_state=42, zero_division=0)
sample
- Augur.sample(adata, categorical, subsample_size, random_state, features)[source]
Sample AnnData observations.
- Parameters:
adata (
AnnData) – Anndata with obs label and cell_type for label and cell type and dummie variable y_ columns used as targetcategorical (
bool) – True if target values are categoricalsubsample_size (
int) – number of cells to subsample randomly per type from each experimental conditionrandom_state (
int) – set numpy random seed and sampling seedfeatures (
list) – features returned Anndata object
- Returns:
Subsample of AnnData object of size subsample_size with given features
Examples
>>> import pertpy as pt
>>> adata = pt.dt.sc_sim_augur()
>>> ag_rfc = pt.tl.Augur("random_forest_classifier")
>>> loaded_data = ag_rfc.load(adata)
>>> ag_rfc.select_highly_variable(loaded_data)
>>> features = loaded_data.var_names
>>> subsample = ag_rfc.sample(
...     loaded_data, categorical=True, subsample_size=20, random_state=42, features=loaded_data.var_names
... )
select_highly_variable
- Augur.select_highly_variable(adata)[source]
Feature selection by variance using scanpy highly variable genes function.
- Parameters:
adata (
AnnData) – Anndata object containing gene expression values (cells in rows, genes in columns)- Return type:
- Results:
Anndata object with highly variable genes added as layer
Examples
>>> import pertpy as pt
>>> adata = pt.dt.sc_sim_augur()
>>> ag_rfc = pt.tl.Augur("random_forest_classifier")
>>> loaded_data = ag_rfc.load(adata)
>>> ag_rfc.select_highly_variable(loaded_data)
select_variance
- Augur.select_variance(adata, var_quantile, filter_negative_residuals, span=0.75)[source]
Feature selection based on Augur implementation.
- Parameters:
adata (
AnnData) – Anndata objectvar_quantile (
float) – The quantile below which features will be filtered, based on their residuals in a loess model.filter_negative_residuals (
bool) – if True, filter residuals at a fixed threshold of zero, instead of var_quantilespan (
float) – Smoothing factor, as a fraction of the number of points to take into account. Should be in the range (0, 1]. Defaults to 0.75
- Returns:
AnnData object with additional select_variance column in var.
Examples
>>> import pertpy as pt
>>> adata = pt.dt.sc_sim_augur()
>>> ag_rfc = pt.tl.Augur("random_forest_classifier")
>>> loaded_data = ag_rfc.load(adata)
>>> ag_rfc.select_variance(loaded_data, var_quantile=0.5, filter_negative_residuals=False, span=0.75)
set_scorer
- Augur.set_scorer(multiclass, zero_division)[source]
Set scoring fuctions for cross-validation based on estimator.
- Parameters:
- Return type:
- Returns:
Dict linking name to scorer object and string name
Examples
>>> import pertpy as pt
>>> ag_rfc = pt.tl.Augur("random_forest_classifier")
>>> scorer = ag_rfc.set_scorer(True, 0)