Note
This page was generated from dialogue.ipynb. Some tutorial content may look better in light mode.
DIALOGUE - multi cellular programs
Dialogue is an algorithm which uses canonical correlation analysis (CCA) to identify gene expression signatures which are correlated across multiple cell types across samples. This is a Python re-implementation of the Dialogue R package, with some modifications and extensions.
Dialogue’s matrix decomposition runs on sample averages in PCA space. It is best to have at least 10 samples per condition of interest. The data used here is a subset of the ulcerative colitis dataset investigated in the original paper.
[2]:
import warnings

warnings.filterwarnings("ignore", category=DeprecationWarning, module="pertpy")

import pandas as pd
import pertpy as pt
import scanpy as sc
[2]:
adata = pt.dt.dialogue_example()
adata
[2]:
AnnData object with n_obs × n_vars = 5374 × 6329
    obs: 'nCount_RNA', 'nFeature_RNA', 'cellQ', 'gender', 'location', 'clinical.status', 'cell.subtypes', 'pathology', 'origin', 'subset'
    var: 'name'
The Dialogue example dataset doesn’t have sample ID explicitly annotated, but we can extract sample IDs from the cell labels.
For the comparisons and plotting functionality to look at how pathology is related to Dialogue score, we need a categorical variable, so we create a new column “path_str” and label with the pathology status of each cell.
[4]:
sc.pp.pca(adata)
sc.pp.neighbors(adata)
sc.tl.umap(adata)
[5]:
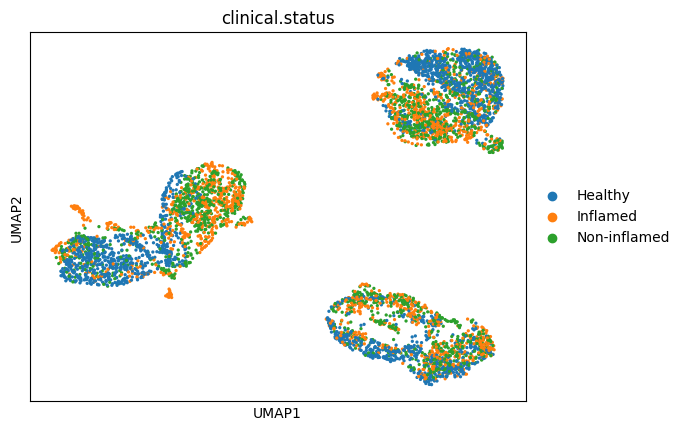
sc.pl.umap(
    adata,
    color=["clinical.status"],
)
[6]:
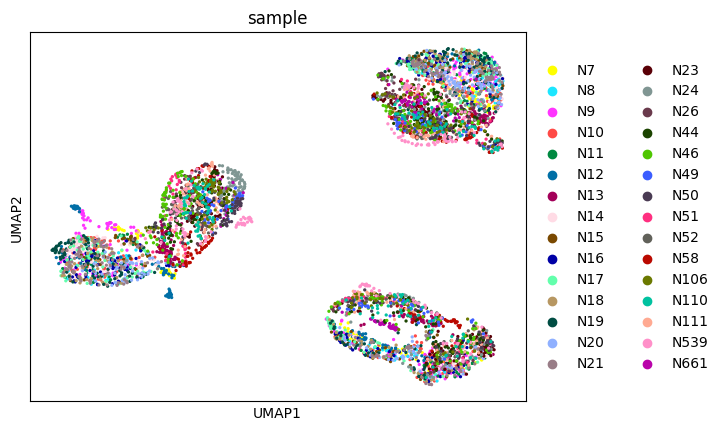
sc.pl.umap(
    adata,
    color=["sample"],
)
[7]:
# ensure that every cell type is represented in every sample
isecs = pd.crosstab(adata.obs["cell.subtypes"], adata.obs["sample"])

isecs
(isecs > 3).sum(axis=1)
[7]:
cell.subtypes
CD8+ IELs      29
CD8+ IL17+      9
CD8+ LP        30
Macrophages    30
TA2            30
dtype: int64
[8]:
# based on what we see above, remove CD8+ IL17+ because it's poorly represented across samples
adata = adata[adata.obs["cell.subtypes"] != "CD8+ IL17+"]
isecs = pd.crosstab(adata.obs["cell.subtypes"], adata.obs["sample"])

# then remove the any sample which now has an unrepresented cell type
keep_pts = list(isecs.loc[:, (isecs > 3).sum(axis=0) == isecs.shape[0]].columns.values)
adata = adata[adata.obs["sample"].isin(keep_pts), :].copy()
[9]:
adata
[9]:
AnnData object with n_obs × n_vars = 5156 × 6329
    obs: 'nCount_RNA', 'nFeature_RNA', 'cellQ', 'gender', 'location', 'clinical.status', 'cell.subtypes', 'pathology', 'origin', 'subset', 'sample', 'path_str'
    var: 'name'
    uns: 'pca', 'neighbors', 'umap', 'clinical.status_colors', 'sample_colors'
    obsm: 'X_pca', 'X_umap'
    varm: 'PCs'
    obsp: 'distances', 'connectivities'
[10]:
dl = pt.tl.Dialogue(
    sample_id="sample",
    celltype_key="cell.subtypes",
    n_counts_key="nCount_RNA",
    n_mpcs=3,
)
[11]:
adata, mcps, ws, ct_subs = dl.calculate_multifactor_PMD(adata, normalize=True)
[12]:
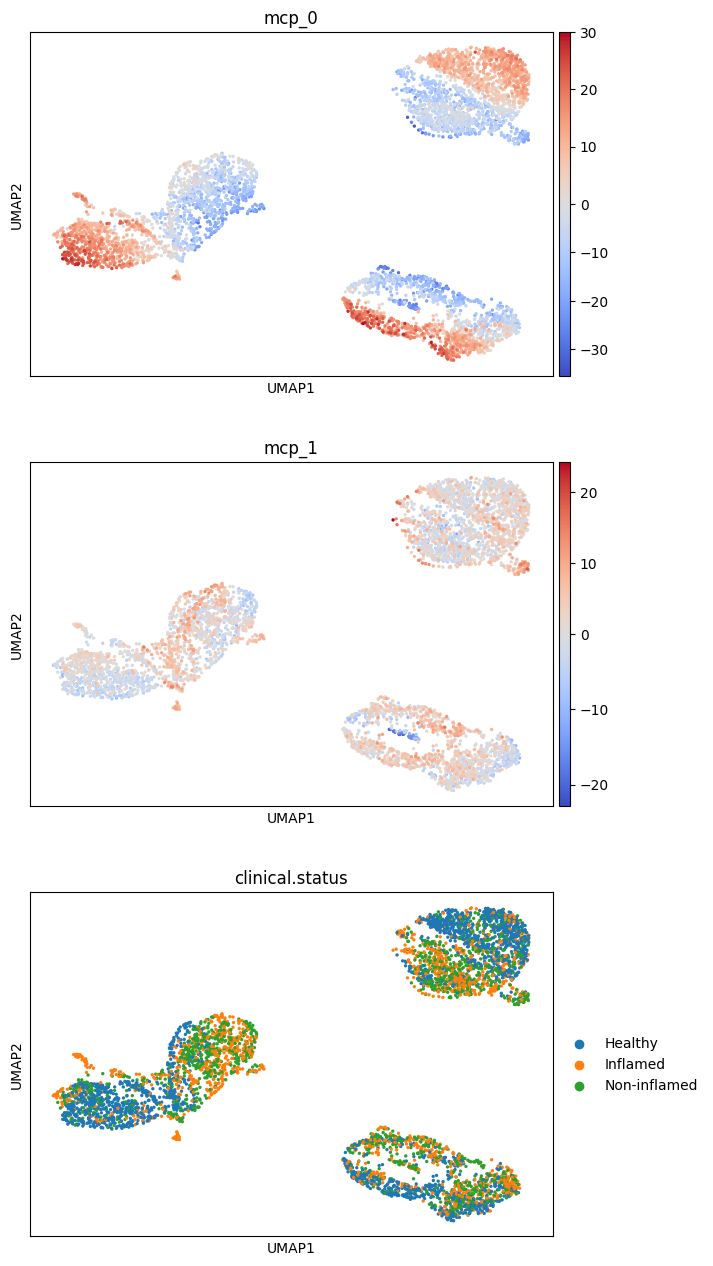
sc.pl.umap(
    adata,
    color=["mcp_0", "mcp_1", "clinical.status"],
    ncols=1,
    cmap="coolwarm",
    vcenter=0,
)
First, we test which MCPs are associated with pathology status:
[13]:
dl.test_association(adata, "path_str")
[13]:
{'pvals':                 mcp_0     mcp_1     mcp_2
 CD8+ IELs    0.002495  0.760186  0.026097
 CD8+ LP      0.003275  0.335389  0.013104
 Macrophages  0.011599  0.267990  0.019691
 TA2          0.000298  0.485668  0.000004,
 'tstats':                 mcp_0     mcp_1     mcp_2
 CD8+ IELs    3.334117 -0.308345 -2.354108
 CD8+ LP      3.226379 -0.980819 -2.656113
 Macrophages  2.708076  1.131028 -2.479509
 TA2          4.149622 -0.706928 -5.761043,
 'pvals_adj':                 mcp_0     mcp_1     mcp_2
 CD8+ IELs    0.004367  0.760186  0.026097
 CD8+ LP      0.004367  0.647557  0.026097
 Macrophages  0.011599  0.647557  0.026097
 TA2          0.001190  0.647557  0.000016}
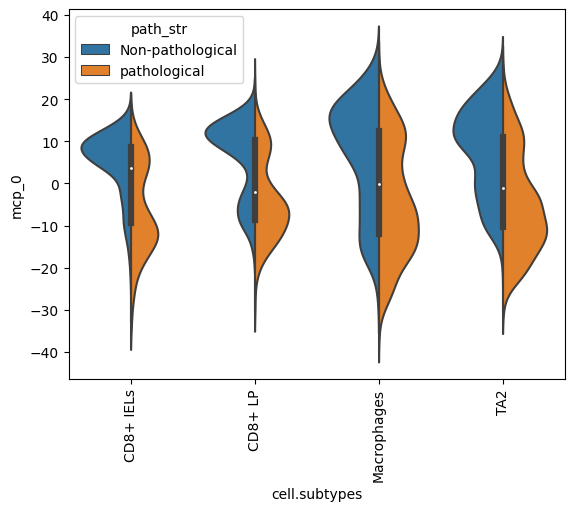
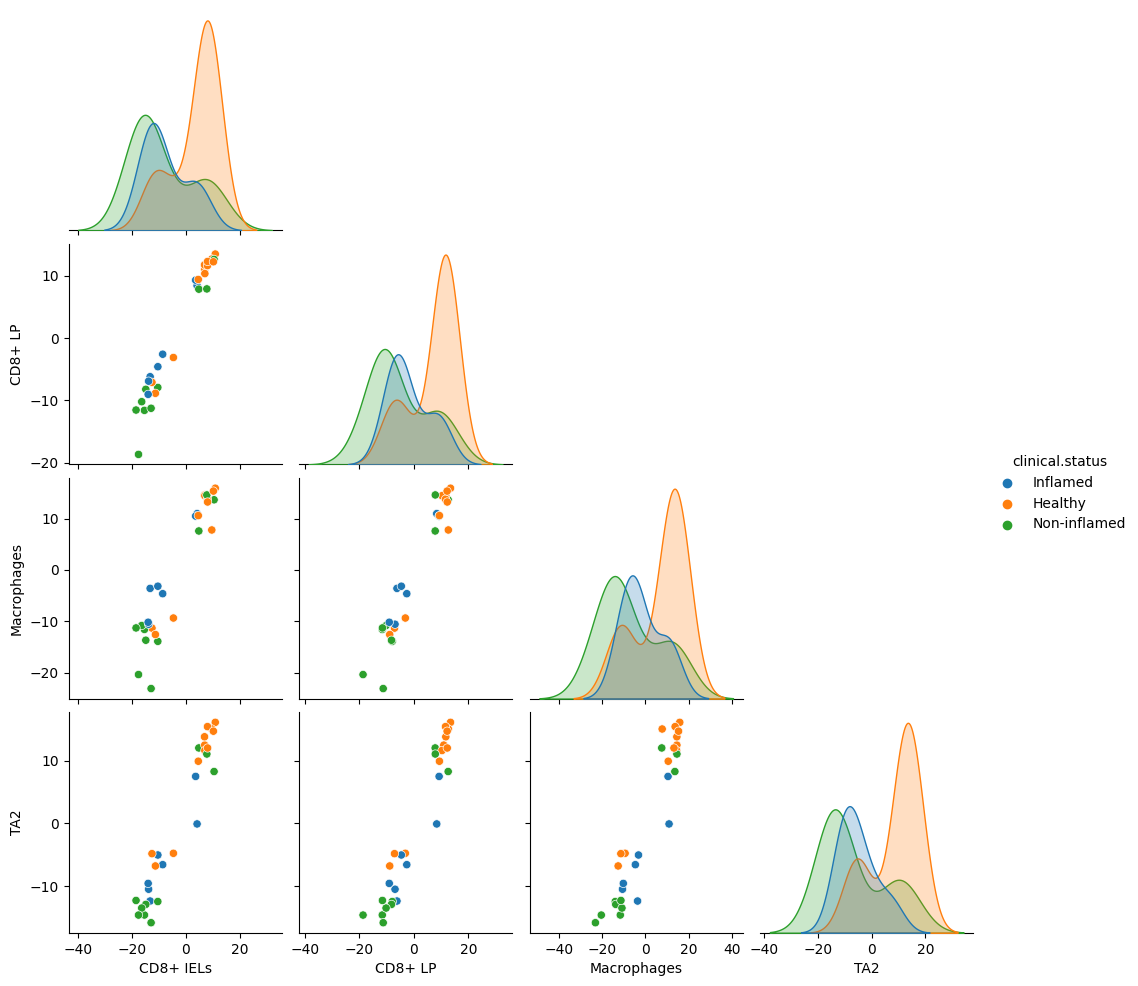
mcp_0 looks significantly associated with pathology status. Let’s plot its values for individual cells of different source pathologies
[14]:
dl.plot_split_violins(adata, split_key="path_str", celltype_key="cell.subtypes", mcp="mcp_0")
[14]:
<Axes: xlabel='cell.subtypes', ylabel='mcp_0'>
[15]:
dl.plot_pairplot(
    adata,
    celltype_key="cell.subtypes",
    color="clinical.status",
    mcp="mcp_0",
    sample_id="sample",
)
[15]:
<seaborn.axisgrid.PairGrid at 0x2db1adf10>
Now we want to look at the genes associated with the MCPs. There are two possible ways of doing this. Extrema MCP genes identifies cells with the highest and lowest MCP scores for each MCP and cell type, then uses rank_genes_groups to score MCP-associated genes.
The selection of extrema cells is sample-agnostic. This method also doesn’t add any additional correlation across cell types, so these genes are MCP-associated within the individual cell types, but aren’t tested for two-cell-type pairwise enrichment.
[16]:
extrema_genes = dl.get_extrema_MCP_genes(ct_subs)
WARNING: Default of the method has been changed to 't-test' from 't-test_overestim_var'
WARNING: Default of the method has been changed to 't-test' from 't-test_overestim_var'
WARNING: Default of the method has been changed to 't-test' from 't-test_overestim_var'
WARNING: Default of the method has been changed to 't-test' from 't-test_overestim_var'
WARNING: Default of the method has been changed to 't-test' from 't-test_overestim_var'
WARNING: Default of the method has been changed to 't-test' from 't-test_overestim_var'
WARNING: Default of the method has been changed to 't-test' from 't-test_overestim_var'
WARNING: Default of the method has been changed to 't-test' from 't-test_overestim_var'
WARNING: Default of the method has been changed to 't-test' from 't-test_overestim_var'
WARNING: Default of the method has been changed to 't-test' from 't-test_overestim_var'
WARNING: Default of the method has been changed to 't-test' from 't-test_overestim_var'
WARNING: Default of the method has been changed to 't-test' from 't-test_overestim_var'
[17]:
# the top 10% of TA2 mcp_0 scores compared to the bottom 10%
extrema_genes["mcp_0"]["TA2"].head(10)
[17]:
| names | scores | logfoldchanges | pvals | pvals_adj | |
|---|---|---|---|---|---|
| 0 | LGALS4 | 30.725128 | 3.706235 | 5.814764e-96 | 3.680164e-92 |
| 1 | FABP1 | 27.608805 | 10.455679 | 1.147060e-77 | 1.451949e-74 |
| 2 | CA2 | 22.598703 | 7.000807 | 1.233979e-66 | 1.301643e-63 |
| 3 | COX4I1 | 21.681202 | 1.968014 | 7.606420e-61 | 6.017629e-58 |
| 4 | ADIRF | 21.092482 | 6.183791 | 1.339211e-63 | 1.210838e-60 |
| 5 | SELENBP1 | 20.836832 | 5.738823 | 1.674979e-57 | 1.060094e-54 |
| 6 | HMGCS2 | 20.143518 | 6.274435 | 7.779422e-59 | 5.470662e-56 |
| 7 | LGALS3 | 19.963385 | 3.821214 | 2.782692e-52 | 1.354743e-49 |
| 8 | URAD | 19.835522 | 6.441755 | 2.841218e-56 | 1.498506e-53 |
| 9 | PHGR1 | 18.831448 | 3.467256 | 1.124717e-51 | 5.084525e-49 |
This multilevel modeling method matches the modeling used in the original Dialogue paper. It uses modeling to find genes which are correlated with MCP score in pairs of cell types.
[18]:
# Note: this is computationally complex! It takes 1 hour to run on a laptop with 16 GB RAM
all_results, new_mcps = dl.multilevel_modeling(
    ct_subs=ct_subs,
    mcp_scores=mcps,
    ws_dict=ws,
    confounder="gender",
)
3 MCPs identified for CD8+ IELs and CD8+ LP.
3 MCPs identified for CD8+ IELs and Macrophages.
3 MCPs identified for CD8+ IELs and TA2.
3 MCPs identified for CD8+ LP and Macrophages.
3 MCPs identified for CD8+ LP and TA2.
3 MCPs identified for Macrophages and TA2.
The multilevel modeling output gives MCP genes for pairwise comparisons only. To extract MCP genes for each cell type more generally, we want to find genes which are consistent across multiple pairwise comparisons. The original Dialogue uses an adaptive threshold for this; here we’ve implemented a simpler flat threshhold, where genes are part of the final set only if they’re present in at least a threshold-fraction of the observed cell types.
We’ll take a look at the genes the model returns in TA2 cells.
[22]:
ta2_genes = dl.get_mlm_mcp_genes(celltype="TA2", results=all_results, MCP="mcp_0", threshold=0.70)
The aggregation function returns a dictionary of “up_genes” and “down_genes” for each MCP for this cell types.
Let’s compare these with the genes from the extrema testing
[56]:
# extract significantly different genes from the extrema calculation
sig_genes = extrema_genes["mcp_0"]["TA2"][extrema_genes["mcp_0"]["TA2"]["pvals_adj"] < 0.05]
up_genes_extrema = sig_genes[sig_genes["logfoldchanges"] > 0]["names"]
down_genes_extrema = sig_genes[sig_genes["logfoldchanges"] < 0]["names"]
# all of the Dialogue genes from the multilevel model are also in this list
len(set(ta2_genes["up_genes"]).intersection(set(up_genes_extrema))) == len(set(ta2_genes["up_genes"]))
[56]:
101
[60]:
print(
    f"DIALOGUE decreased genes that are also in the extrema decreased list: {set(ta2_genes['down_genes']).intersection(set(down_genes_extrema))}"
)
print(
    f"DIALOGUE decreased genes that are not in the extrema decreased list: {set(ta2_genes['down_genes']).difference(set(down_genes_extrema))}"
)
{'RPL39', 'RPS29', 'TSPAN8', 'RPS27', 'RPS17L', 'MTRNR2L3', 'USMG5'}
[60]:
{'CALM2', 'STAG2'}