pertpy.tools.Enrichment
Methods table
|
Perform gene set enrichment analysis on the marker gene scores using blitzgsea. |
|
Perform a hypergeometric test to assess the overrepresentation of gene group members. |
|
Obtain per-cell scoring of gene groups of interest. |
|
Plots a dotplot by groupby and categories. |
|
Generates a blitzgsea top_table plot. |
Methods
gsea
- Enrichment.gsea(adata, targets=None, nested=False, categories=None, absolute=False, key_added='pertpy_enrichment_gsea')[source]
Perform gene set enrichment analysis on the marker gene scores using blitzgsea.
- Parameters:
adata (
AnnData) – AnnData object with marker genes computed via sc.tl.rank_genes_groups() in the original expression space.targets (
dict[str,list[str] |dict[str,list[str]]] |None) – The gene groups to evaluate, either as a dictionary with names of the groups as keys and gene lists as values, or a dictionary of dictionaries with names of gene group categories as keys. Defaults to None, in which case it uses d2c.score() output or loads ChEMBL-derived drug target sets.nested (
bool) – Indicates if targets is a dictionary of dictionaries with group categories as keys. Defaults to False.categories (
str|list[str] |None) – Used to subset the gene groups to one or more categories, applicable if targets=None or nested=True. Defaults to None.absolute (
bool) – If True, passes the absolute values of scores to GSEA, improving statistical power. Defaults to False.key_added (
str) – Prefix key that adds the results to uns. Defaults to pertpy_enrichment_gsea.
- Return type:
dict[str,DataFrame] |tuple[dict[str,DataFrame],dict[str,dict]]- Returns:
A dictionary with clusters as keys and data frames of test results sorted on q-value as the items.
hypergeometric
- Enrichment.hypergeometric(adata, targets=None, nested=False, categories=None, pvals_adj_thresh=0.05, direction='both', corr_method='benjamini-hochberg')[source]
Perform a hypergeometric test to assess the overrepresentation of gene group members.
- Parameters:
adata (
AnnData) – With marker genes computed via sc.tl.rank_genes_groups() in the original expression space.targets (
dict[str,list[str] |dict[str,list[str]]] |None) –The gene groups to evaluate. Can be targets of known drugs, GO terms, pathway memberships, anything you can assign genes to. If None, will use d2c.score() output if present, and if not present load the ChEMBL-derived drug target sets distributed with the package. Accepts two forms: - A dictionary with the names of the groups as keys, and the entries being the corresponding gene lists. - A dictionary of dictionaries defined like above, with names of gene group categories as keys.
If passing one of those, specify nested=True.
nested (
bool) – Whether targets is a dictionary of dictionaries with group categories as keys.categories (
str|list[str] |None) – If targets=None or nested=True, this argument can be used to subset the gene groups to one or more categories (keys of the original dictionary). In case of the ChEMBL drug targets, these are ATC level 1/level 2 category codes.pvals_adj_thresh (
float) – The pvals_adj cutoff to use on the sc.tl.rank_genes_groups() output to identify markers.direction (
str) – Whether to seek out up/down-regulated genes for the groups, based on the values from scores. Can be up, down, or both (for no selection).corr_method (
Literal['benjamini-hochberg','bonferroni']) – Which FDR correction to apply to the p-values of the hypergeometric test. Can be benjamini-hochberg or bonferroni.
- Returns:
Dictionary with clusters for which the original object markers were computed as the keys, and data frames of test results sorted on q-value as the items.
plot_dotplot
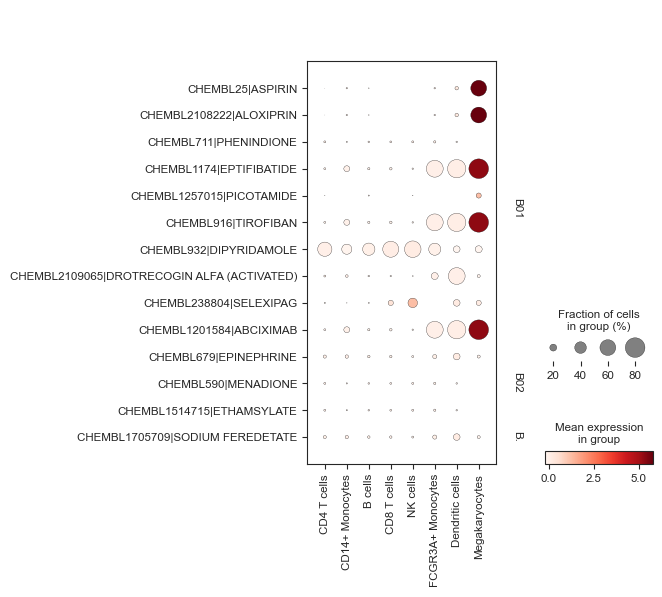
- Enrichment.plot_dotplot(adata, targets=None, source='chembl', category_name='interaction_type', categories=None, groupby=None, key='pertpy_enrichment', ax=None, save=None, show=None, **kwargs)[source]
Plots a dotplot by groupby and categories.
Wraps scanpy’s dotplot but formats it nicely by categories.
- Parameters:
adata (
AnnData) – An AnnData object with enrichment results stored in .uns[“pertpy_enrichment_score”].targets (
dict[str,dict[str,list[str]]]) – Gene groups to evaluate, which can be targets of known drugs, GO terms, pathway memberships, etc. Accepts a dictionary of dictionaries with group categories as keys. If not provided, ChEMBL-derived or dgbidb drug target sets are used, given by source.source (
Literal['chembl','dgidb','pharmgkb']) – Source of drug target sets when targets=None, chembl, dgidb or pharmgkb. Defaults to chembl.categories (
Sequence[str]) – To subset the gene groups to specific categories, especially when targets=None. For ChEMBL drug targets, these are ATC level 1/level 2 category codes.category_name (
str) – The name of category used to generate a nested drug target set when targets=None and source=dgidb|pharmgkb. Defaults to interaction_type.groupby (
str) – dotplot groupby such as clusters or cell types.key (
str) – Prefix key of enrichment results in uns. Defaults to pertpy_enrichment.kwargs – Passed to scanpy dotplot.
- Return type:
- Returns:
If return_fig is True, returns a
DotPlotobject, else if show is false, return axes dict.
Examples
>>> import pertpy as pt
>>> import scanpy as sc
>>> pt_enrichment = pt.tl.Enrichment()
>>> adata = sc.datasets.pbmc3k_processed()
>>> pt_enrichment.score(adata)
>>> sc.tl.rank_genes_groups(adata, method="wilcoxon", groupby="louvain")
>>> pt_enrichment.plot_dotplot(adata, categories=["B01", "B02", "B03"], groupby="louvain")
- Preview:
plot_gsea
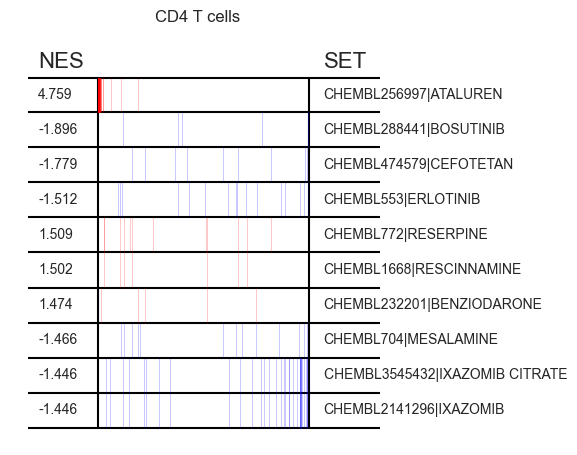
- Enrichment.plot_gsea(adata, enrichment, n=10, key='pertpy_enrichment_gsea', interactive_plot=False)[source]
Generates a blitzgsea top_table plot.
This function is designed to visualize the results from a Gene Set Enrichment Analysis (GSEA). It uses the output from the gsea() method, which provides the enrichment data, and displays the top results using blitzgsea’s top_table() plot.
- Parameters:
adata (
AnnData) – AnnData object to plot.enrichment (
dict[str,DataFrame]) – Cluster names as keys, blitzgsea’sgsea()output as values.n (
int) – How many top scores to show for each group. Defaults to 10.key (
str) – GSEA results key in uns. Defaults to “pertpy_enrichment_gsea”.interactive_plot (
bool) – Whether to plot interactively or not. Defaults to False.
- Return type:
Examples
>>> import pertpy as pt
>>> import scanpy as sc
>>> pt_enrichment = pt.tl.Enrichment()
>>> adata = sc.datasets.pbmc3k_processed()
>>> pt_enrichment.score(adata)
>>> sc.tl.rank_genes_groups(adata, method="wilcoxon", groupby="louvain")
>>> enrichment = pt_enrichment.gsea(adata)
>>> pt_enrichment.plot_gsea(adata, enrichment, interactive_plot=True)
- Preview:
score
- Enrichment.score(adata, layer=None, targets=None, nested=False, categories=None, method='mean', n_bins=25, ctrl_size=50, key_added='pertpy_enrichment')[source]
Obtain per-cell scoring of gene groups of interest.
Inspired by drug2cell score: https://github.com/Teichlab/drug2cell. Ensure that the gene nomenclature in your target sets is compatible with your .var_names. The ChEMBL drug targets use HGNC.
- Parameters:
adata (
AnnData) – An AnnData object. It is recommended to use log-normalised data.targets (
dict[str,list[str]] |dict[str,dict[str,list[str]]]) – Gene groups to evaluate, which can be targets of known drugs, GO terms, pathway memberships, etc. Accepts two forms: - A dictionary with group names as keys and corresponding gene lists as entries. - A dictionary of dictionaries with group categories as keys. Use nested=True in this case. If not provided, ChEMBL-derived drug target sets are used.nested (
bool) – Indicates if targets is a dictionary of dictionaries with group categories as keys. Defaults to False.categories (
Sequence[str]) – To subset the gene groups to specific categories, especially when targets=None or nested=True. For ChEMBL drug targets, these are ATC level 1/level 2 category codes.method (
Literal['mean','seurat']) – Method for scoring gene groups. “mean” calculates the mean over all genes, while “seurat” uses a background profile subtraction approach. Defaults to ‘mean’.layer (
str) – Specifies which .layers of AnnData to use for expression values. Defaults to .X if None.n_bins (
int) – The number of expression bins for the ‘seurat’ method.ctrl_size (
int) – The number of genes to randomly sample from each expression bin for the “seurat” method.key_added (
str) – Prefix key that adds the results to uns. Note that the actual values are key_added_score, key_added_variables, key_added_genes, key_added_all_genes. Defaults to pertpy_enrichment.
- Return type:
- Returns:
An AnnData object with scores.