pertpy.tools.Dialogue
- class pertpy.tools.Dialogue(sample_id, celltype_key, n_counts_key, n_mpcs)[source]
Python implementation of DIALOGUE
Methods table
|
Runs multifactor PMD. |
|
Identifies cells with extreme MCP scores. |
|
Extracts MCP genes from the MCP multilevel modeling object for the cell type of interest. |
|
Runs the multilevel modeling step to match genes to MCPs and generate p-values for MCPs. |
|
Tests association between MCPs and a binary response variable (e.g. response to treatment). |
|
Generate a pairplot visualization for multi-cell perturbation (MCP) data. |
|
Plots split violin plots for a given MCP and split variable. |
Methods
calculate_multifactor_PMD
- Dialogue.calculate_multifactor_PMD(adata, penalties=None, ct_order=None, agg_pca=True, solver='bs', normalize=True)[source]
Runs multifactor PMD.
Currently mimics DIALOGUE1.
- Parameters:
adata (
AnnData) – AnnData object to calculate PMD for.sample_id – Key to use for pseudobulk determination.
agg_pca (
bool) – Whether to calculate cell-averaged PCA components.solver (
Literal['lp','bs']) – Which solver to use for PMD. Must be one of “lp” (linear programming) or “bs” (binary search). For differences between these to please refer to https://github.com/theislab/sparsecca/blob/main/examples/linear_programming_multicca.ipynb Defaults to ‘bs’.normalize (
bool) – Whether to mimic DIALOGUE as close as possible
- Return type:
tuple[AnnData,dict[str,ndarray],dict[Any,Any],dict[Any,Any]]- Returns:
MCP scores # TODO this requires more detail
Examples
>>> import pertpy as pt
>>> import scanpy as sc
>>> adata = pt.dt.dialogue_example()
>>> sc.pp.pca(adata)
>>> dl = pt.tl.Dialogue(
...     sample_id="clinical.status", celltype_key="cell.subtypes", n_counts_key="nCount_RNA", n_mpcs=3
... )
>>> adata, mcps, ws, ct_subs = dl.calculate_multifactor_PMD(adata, normalize=True)
get_extrema_MCP_genes
- Dialogue.get_extrema_MCP_genes(ct_subs, fraction=0.1)[source]
Identifies cells with extreme MCP scores.
Takes as input a dictionary of subpopulations AnnData objects (DIALOGUE output), For each MCP it identifies cells with extreme MCP scores, then calls rank_genes_groups to identify genes which are differentially expressed between high-scoring and low-scoring cells.
- Parameters:
- Returns:
Nested dictionary where keys of the first level are MCPs (of the form “mcp_0” etc) and the second level keys are cell types. The values are dataframes containing the results of the rank_genes_groups analysis.
Examples
>>> import pertpy as pt
>>> import scanpy as sc
>>> adata = pt.dt.dialogue_example()
>>> sc.pp.pca(adata)
>>> dl = pt.tl.Dialogue(sample_id = "clinical.status", celltype_key = "cell.subtypes",                 n_counts_key = "nCount_RNA", n_mpcs = 3)
>>> adata, mcps, ws, ct_subs = dl.calculate_multifactor_PMD(adata, normalize=True)
>>> extrema_mcp_genes = dl.get_extrema_MCP_genes(ct_subs)
get_mlm_mcp_genes
- Dialogue.get_mlm_mcp_genes(celltype, results, MCP='mcp_0', threshold=0.7, focal_celltypes=None)[source]
Extracts MCP genes from the MCP multilevel modeling object for the cell type of interest.
- Parameters:
celltype (
str) – Cell type of interest.results (
dict) – dl.MultilevelModeling result object.MCP (
str) – MCP key of the result object.threshold (
float) – Number between [0,1]. The fraction of cell types compared against which must have the associated MCP gene. Defaults to 0.70.focal_celltypes (
list[str] |None) – None (compare against all cell types) or a list of other cell types which you want to compare against. Defaults to None.
- Returns:
Dict with keys ‘up_genes’ and ‘down_genes’ and values of lists of genes
Examples
>>> import pertpy as pt
>>> import scanpy as sc
>>> adata = pt.dt.dialogue_example()
>>> sc.pp.pca(adata)
>>> dl = pt.tl.Dialogue(sample_id = "clinical.status", celltype_key = "cell.subtypes",                 n_counts_key = "nCount_RNA", n_mpcs = 3)
>>> adata, mcps, ws, ct_subs = dl.calculate_multifactor_PMD(adata, normalize=True)
>>> all_results, new_mcps = dl.multilevel_modeling(ct_subs=ct_subs, mcp_scores=mcps, ws_dict=ws,                 confounder="gender")
>>> mcp_genes = dl.get_mlm_mcp_genes(celltype='Macrophages', results=all_results)
multilevel_modeling
- Dialogue.multilevel_modeling(ct_subs, mcp_scores, ws_dict, confounder, formula=None)[source]
Runs the multilevel modeling step to match genes to MCPs and generate p-values for MCPs.
- Parameters:
- Returns:
for each mcp: HLM_result_1, HLM_result_2, sig_genes_1, sig_genes_2
merged HLM_result_1, HLM_result_2, sig_genes_1, sig_genes_2 of all mcps
- Return type:
A Pandas DataFrame containing
Examples
>>> import pertpy as pt
>>> import scanpy as sc
>>> adata = pt.dt.dialogue_example()
>>> sc.pp.pca(adata)
>>> dl = pt.tl.Dialogue(sample_id = "clinical.status", celltype_key = "cell.subtypes",                 n_counts_key = "nCount_RNA", n_mpcs = 3)
>>> adata, mcps, ws, ct_subs = dl.calculate_multifactor_PMD(adata, normalize=True)
>>> all_results, new_mcps = dl.multilevel_modeling(ct_subs=ct_subs, mcp_scores=mcps, ws_dict=ws,                 confounder="gender")
plot_pairplot
- Dialogue.plot_pairplot(adata, celltype_key, color, sample_id, mcp='mcp_0', return_fig=None, show=None, save=None)[source]
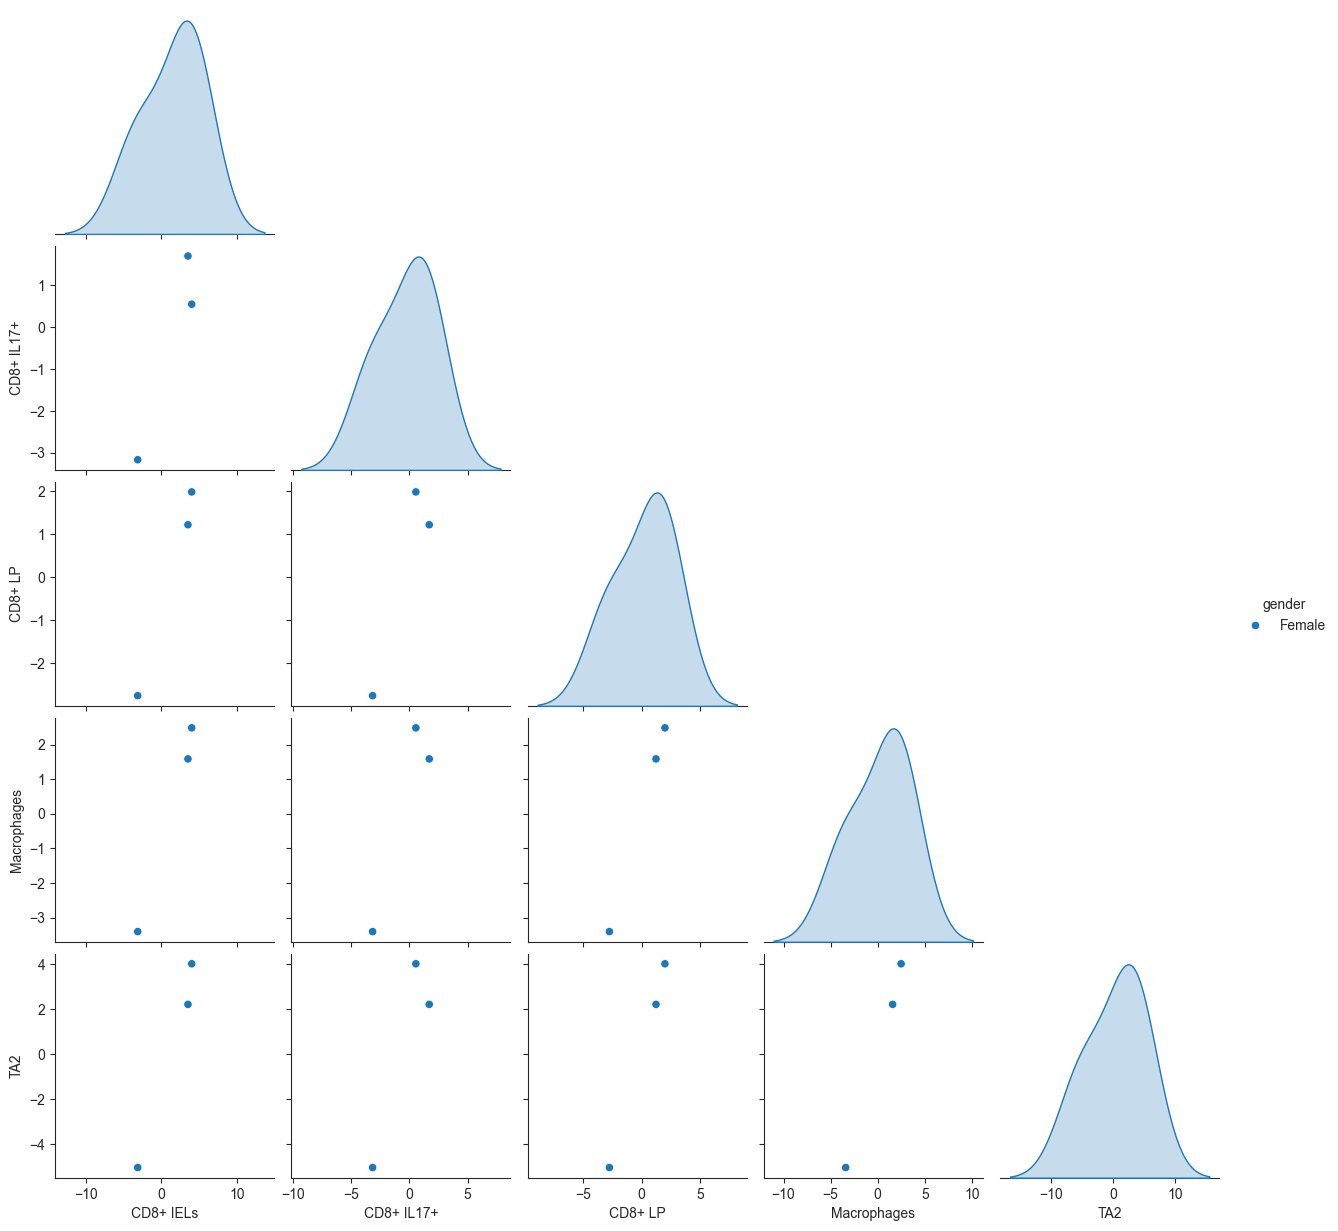
Generate a pairplot visualization for multi-cell perturbation (MCP) data.
Computes the mean of a specified MCP feature (mcp) for each combination of sample and cell type, then creates a pairplot to visualize the relationships between these mean MCP values.
- Parameters:
adata (
AnnData) – Annotated data object.celltype_key (
str) – Key in adata.obs containing cell type annotations.color (
str) – Key in adata.obs for color annotations. This parameter is used as the huesample_id (
str) – Key in adata.obs for the sample annotations.mcp (
str) – Key in adata.obs for MCP feature values. Defaults to “mcp_0”.
- Return type:
- Returns:
Seaborn Pairgrid object.
Examples
>>> import pertpy as pt
>>> import scanpy as sc
>>> adata = pt.dt.dialogue_example()
>>> sc.pp.pca(adata)
>>> dl = pt.tl.Dialogue(sample_id = "clinical.status", celltype_key = "cell.subtypes",                 n_counts_key = "nCount_RNA", n_mpcs = 3)
>>> adata, mcps, ws, ct_subs = dl.calculate_multifactor_PMD(adata, normalize=True)
>>> dl.plot_pairplot(adata, celltype_key="cell.subtypes", color="gender", sample_id="clinical.status")
- Preview:
plot_split_violins
- Dialogue.plot_split_violins(adata, split_key, celltype_key, split_which=None, mcp='mcp_0', return_fig=None, ax=None, save=None, show=None)[source]
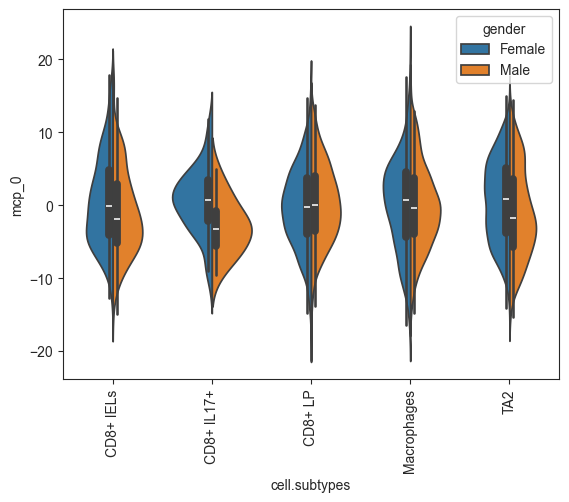
Plots split violin plots for a given MCP and split variable.
Any cells with a value for split_key not in split_which are removed from the plot.
- Parameters:
adata (
AnnData) – Annotated data object.split_key (
str) – Variable in adata.obs used to split the data.celltype_key (
str) – Key for cell type annotations.split_which (
tuple[str,str]) – Which values of split_key to plot. Required if more than 2 values in split_key.mcp (
str) – Key for MCP data. Defaults to “mcp_0”.
- Return type:
- Returns:
A
Axesobject
Examples
>>> import pertpy as pt
>>> import scanpy as sc
>>> adata = pt.dt.dialogue_example()
>>> sc.pp.pca(adata)
>>> dl = pt.tl.Dialogue(sample_id = "clinical.status", celltype_key = "cell.subtypes",                 n_counts_key = "nCount_RNA", n_mpcs = 3)
>>> adata, mcps, ws, ct_subs = dl.calculate_multifactor_PMD(adata, normalize=True)
>>> dl.plot_split_violins(adata, split_key='gender', celltype_key='cell.subtypes')
- Preview:
test_association
- Dialogue.test_association(adata, condition_label, conditions_compare=None)[source]
Tests association between MCPs and a binary response variable (e.g. response to treatment).
Note: benjamini-hochberg corrects for the number of cell types, NOT the number of MCPs
- Parameters:
- Returns:
Dict of data frames with pvals, tstats, and pvals_adj for each MCP
Examples
>>> import pertpy as pt
>>> import scanpy as sc
>>> adata = pt.dt.dialogue_example()
>>> sc.pp.pca(adata)
>>> dl = pt.tl.Dialogue(sample_id = "clinical.status", celltype_key = "cell.subtypes",                 n_counts_key = "nCount_RNA", n_mpcs = 3)
>>> adata, mcps, ws, ct_subs = dl.calculate_multifactor_PMD(adata, normalize=True)
>>> stats = dl.test_association(adata, condition_label="pathology")