Distance Tests#
Pertpy offers several Distance distance metrics to compute distances between groups of cells.
To determine whether two groups came from the same distribution as evaluated by the Distance metric, pertpy provides Monte-Carlo permutation tests.
This can be a valuable tool to assess whether a treatment had a significant effect on the transcript profiles of the cells.
Setup#
import matplotlib.pyplot as plt
import pertpy as pt
import scanpy as sc
Dataset#
Here we use an example dataset, which is a subsetted and already preprocessed
version of data from the original Perturb-seq paper (Dixit et al., 2016). The full dataset can be accessed using
pt.dt.dixit_2016().
Note that most distances are computed in PCA space to avoid the curse of dimensionality or to speed up computation.
When using your own dataset run scanpy.pp.pca first, prior to using the distance methods.
If you prefer to compute distances in a different space, specify an alternative obsm_key argument when calling the distance function.
adata = pt.dt.distance_example()
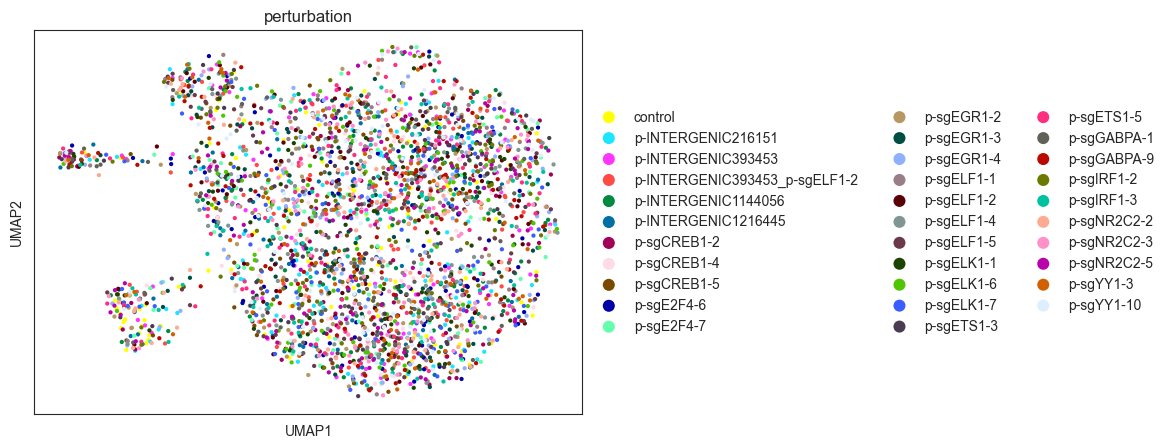
obs_key = "perturbation" # defines groups to test
contrast = "control"
sc.pp.neighbors(adata, use_rep="X_pca", n_neighbors=30, n_pcs=30)
sc.tl.umap(adata)
sc.pl.scatter(adata, basis="umap", color=obs_key, show=True)
E-test (uses E-distance)#
We can run DistanceTest using any of the implemented distance functions. Here we use the E-test, which uses the E-distance as a test statistic.
etest = pt.tl.DistanceTest("edistance", n_perms=1000, obsm_key="X_pca", alpha=0.0015)
tab = etest(adata, groupby=obs_key, contrast=contrast)
We recommend using the adjusted p-values, which are corrected for multiple testing.
You might have to specify a lower alpha value for the adjusted p-values to be significant, depending on the number of permutations, the number of cells in each group, and the number of groups tested (each group increases the number of tests made and therefore affects the adjusted p-value).
Also note that the lowest p-value you can get is 1 / n_permutations, which is the probability of getting the observed distance by chance.
tab.head()
| distance | pvalue | significant | pvalue_adj | significant_adj | |
|---|---|---|---|---|---|
| p-INTERGENIC393453 | 0.460251 | 0.001 | True | 0.031509 | False |
| p-sgELF1-2 | 0.523675 | 0.001 | True | 0.031509 | False |
| p-INTERGENIC216151 | 0.429756 | 0.001 | True | 0.031509 | False |
| p-INTERGENIC1144056 | 0.502560 | 0.001 | True | 0.031509 | False |
| p-sgELF1-5 | 0.510796 | 0.001 | True | 0.031509 | False |
Let’s plot the test results:
import seaborn as sns

with sns.axes_style("darkgrid"):
    sns.scatterplot(
        data=tab[tab.index != contrast],
        x="pvalue",
        y="distance",
        hue="significant",
        palette={True: "green", False: "red"},
    )
plt.title("E-test results")
plt.xlabel("E-test p-value")
plt.ylabel("E-distance to contrast group (control)")
plt.show()

You can see that most permutations are quite different from the control cells, but there are a few that are not. In general, more cells will increase the power of the test. On average, you can expect that cells with a lower distance to control cells will have a lower p-value, tough this depends on the shape of the distribution of distances: almost all distances can be biased by a few outliers, which is why we recommend using a Distance Test to quantify the effect of a treatment on the cells.