DIALOGUE - multi cellular programs#
DIALOGUE [JAR22] discovers multicellular programs (MCPs): coordinated gene-expression patterns that vary together across samples / niches in multiple cell types at once.
The pipeline has three phases:
Sample-pseudobulk each cell type and run penalized multiple-CCA on the cell-type-specific feature spaces to obtain MCP weights and per-cell scores.
For every ordered pair of cell types and every shared MCP, fit a hierarchical linear model of one cell type’s MCP score against the partner cell type’s pseudobulk expression of candidate genes; record signed z-scores.
Combine per-gene evidence across pairs (BH-then-Fisher), then refit the per-cell scores with iterative non-negative least squares on the retained gene set.
Best results require at least ~10 samples per condition. The data here is a subset of the ulcerative colitis cohort from the original paper.
Setup#
import warnings

warnings.filterwarnings("ignore", category=DeprecationWarning, module="pertpy")

import pandas as pd
import pertpy as pt
import scanpy as sc
Dataset#
adata = pt.dt.dialogue_example()
adata
AnnData object with n_obs × n_vars = 5374 × 6329
    obs: 'nCount_RNA', 'nFeature_RNA', 'cellQ', 'gender', 'location', 'clinical.status', 'cell.subtypes', 'pathology', 'origin', 'subset', 'sample', 'path_str'
    var: 'name'
DIALOGUE expects three adata.obs columns: the cell type, the sample / niche label, and a per-cell quality covariate (here cellQ, typically derived from log-counts).
We also encode pathology status as a string column for downstream comparisons.
sc.pp.pca(adata)
sc.pp.neighbors(adata)
sc.tl.umap(adata)
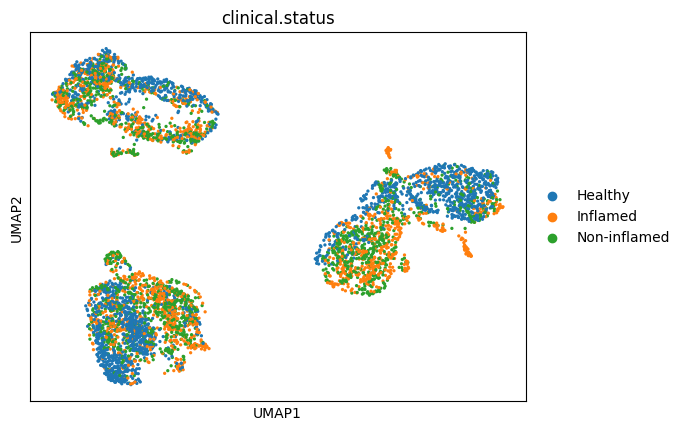
sc.pl.umap(
    adata,
    color=["clinical.status"],
)
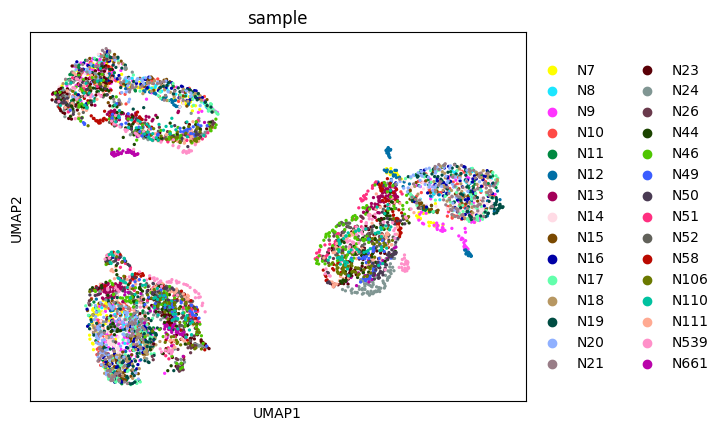
sc.pl.umap(
    adata,
    color=["sample"],
)
# ensure that every cell type is represented in every sample
isecs = pd.crosstab(adata.obs["cell.subtypes"], adata.obs["sample"])

isecs
(isecs > 3).sum(axis=1)
cell.subtypes
CD8+ IELs      29
CD8+ IL17+      9
CD8+ LP        30
Macrophages    30
TA2            30
dtype: int64
# based on what we see above, remove CD8+ IL17+ because it's poorly represented across samples
adata = adata[adata.obs["cell.subtypes"] != "CD8+ IL17+"]
isecs = pd.crosstab(adata.obs["cell.subtypes"], adata.obs["sample"])

# then remove the any sample which now has an unrepresented cell type
keep_pts = list(isecs.loc[:, (isecs > 3).sum(axis=0) == isecs.shape[0]].columns.values)
adata = adata[adata.obs["sample"].isin(keep_pts), :].copy()
adata
AnnData object with n_obs × n_vars = 5156 × 6329
    obs: 'nCount_RNA', 'nFeature_RNA', 'cellQ', 'gender', 'location', 'clinical.status', 'cell.subtypes', 'pathology', 'origin', 'subset', 'sample', 'path_str'
    var: 'name'
    uns: 'pca', 'neighbors', 'umap', 'clinical.status_colors', 'sample_colors'
    obsm: 'X_pca', 'X_umap'
    varm: 'PCs'
    obsp: 'distances', 'connectivities'
Running DIALOGUE#
The pipeline has three phases, called in order on the same AnnData:
fit_programs(adata)— pseudobulk per sample, run penalized multiple-CCA, score every cell.test_celltype_pairs(adata)— fit a per-pair HLM of one cell type’s program score against the partner’s pseudobulk expression of candidate genes.refine_scores(adata)— Fisher-combine the per-gene evidence across pairs and refit per-cell scores with iterative non-negative least squares.
Results live on adata.obsm["X_dialogue"], adata.obs["mcp_0"/"mcp_1"/...], and adata.uns["dialogue"].
dl = pt.tl.Dialogue(
    celltype_key="cell.subtypes",
    sample_key="sample",
    cell_quality_key="cellQ",
    n_programs=3,
)
dl.fit_programs(adata)
dl.test_celltype_pairs(adata)
dl.refine_scores(adata)
AnnData object with n_obs × n_vars = 5156 × 6329
    obs: 'nCount_RNA', 'nFeature_RNA', 'cellQ', 'gender', 'location', 'clinical.status', 'cell.subtypes', 'pathology', 'origin', 'subset', 'sample', 'path_str', 'mcp_0', 'mcp_1', 'mcp_2'
    var: 'name'
    uns: 'pca', 'neighbors', 'umap', 'clinical.status_colors', 'sample_colors', 'dialogue'
    obsm: 'X_pca', 'X_umap', 'X_dialogue_cca', 'X_dialogue'
    varm: 'PCs'
    obsp: 'distances', 'connectivities'
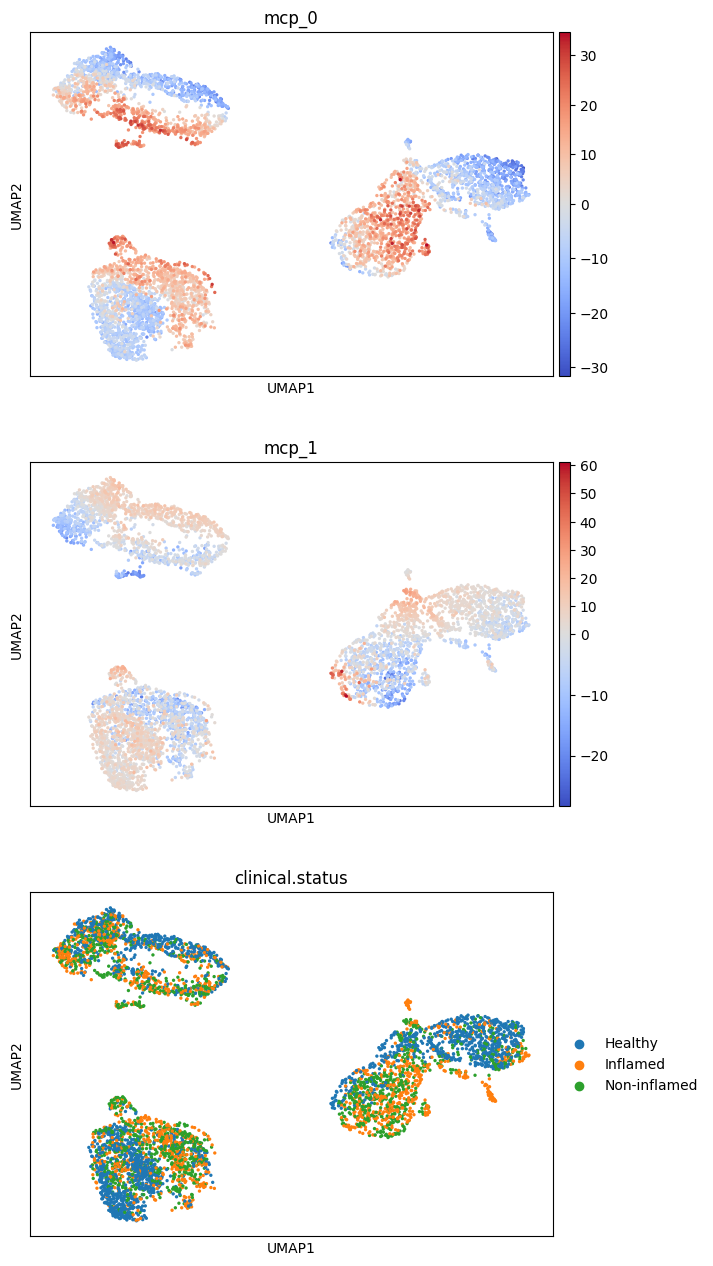
sc.pl.umap(
    adata,
    color=["mcp_0", "mcp_1", "clinical.status"],
    ncols=1,
    cmap="coolwarm",
    vcenter=0,
)
test_phenotype_association fits one HLM per (cell type, program) of the MCP score against a binary phenotype, controlling for cellQ and the sample random effect, and returns a signed z-score table. The Fisher-combined p-value across cell types per program is stored on adata.uns["dialogue"]["phenotype_pvalues"].
dl.test_phenotype_association(adata, condition_key="path_str")
| MCP1 | MCP2 | MCP3 | |
|---|---|---|---|
| CD8+ IELs | 3.497111 | -2.076136 | -3.069563 |
| CD8+ LP | 3.164867 | -2.193559 | -2.896938 |
| Macrophages | 2.323313 | -2.536676 | -1.527735 |
| TA2 | 4.911061 | -4.635892 | -2.395600 |
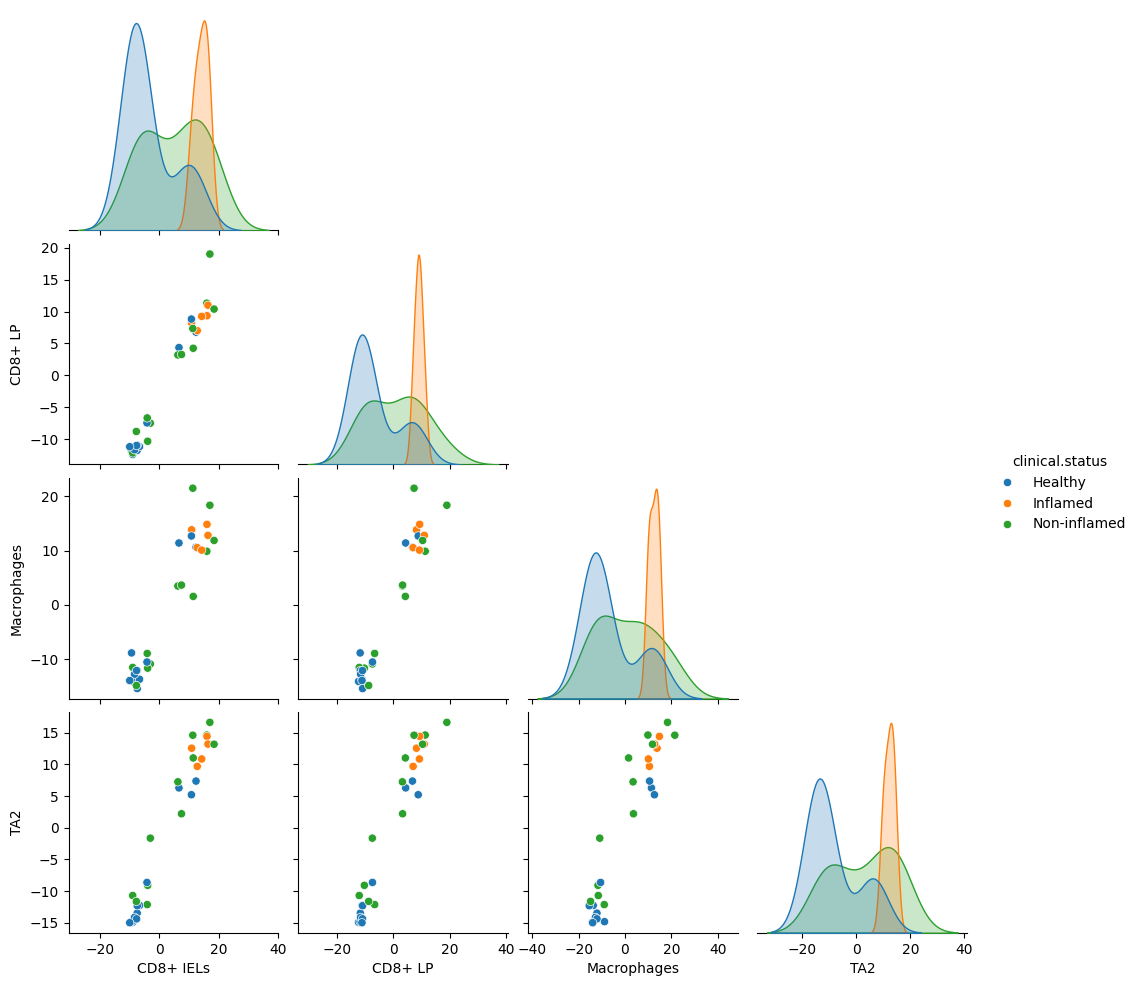
mcp_0 looks significantly associated with pathology status. Two helper plots zoom in:
dl.plot_split_violins(adata, condition_key="path_str", program="MCP1")
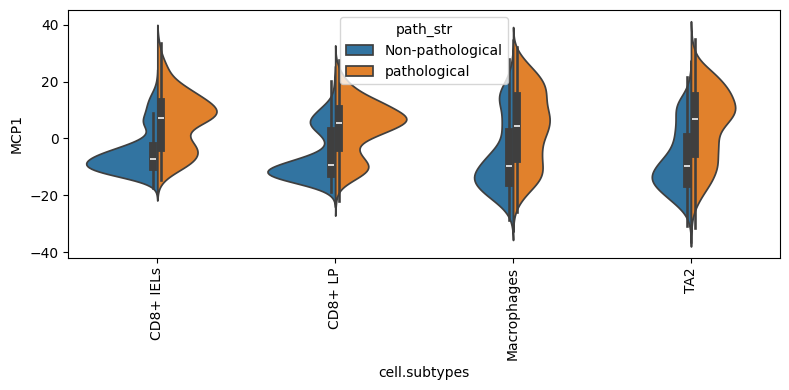
dl.plot_pairplot(adata, color="clinical.status", program="MCP1")
There are two complementary ways to inspect program-associated genes.
find_extreme_score_genes runs rank_genes_groups between the cells with the highest and lowest MCP scores per cell type. It does not enforce any cross-cell-type consistency, so it surfaces correlates within each cell type.
extrema_genes = dl.find_extreme_score_genes(adata, program="MCP1")
# top 10% of TA2 MCP1 scores compared to the bottom 10%
extrema_genes["TA2"].head(10)
| names | scores | logfoldchanges | pvals | pvals_adj | |
|---|---|---|---|---|---|
| 0 | RPL39 | 26.730883 | 7.022243 | 1.149786e-72 | 3.638499e-69 |
| 1 | MT-ND3 | 21.852318 | 6.410341 | 7.542071e-66 | 9.546754e-63 |
| 2 | OLFM4 | 21.784616 | 8.818990 | 2.923116e-68 | 4.625100e-65 |
| 3 | SLC12A2 | 20.205370 | 7.086151 | 8.918870e-55 | 8.063933e-52 |
| 4 | RPL37A | 15.741355 | 1.527921 | 4.899277e-43 | 2.067168e-40 |
| 5 | SET | 15.345827 | 4.804560 | 7.928517e-41 | 2.787755e-38 |
| 6 | RPS27 | 14.957617 | 1.655673 | 1.140456e-39 | 3.608972e-37 |
| 7 | RPL34 | 14.471596 | 2.066507 | 2.839390e-37 | 6.911729e-35 |
| 8 | SPINK1 | 14.401064 | 5.227811 | 1.116510e-37 | 2.826557e-35 |
| 9 | RPS29 | 12.806780 | 1.622585 | 2.719303e-31 | 3.585515e-29 |
get_program_genes exposes the refined signatures from the pair-level / iterative-NNLS path that matches the original DIALOGUE paper. The candidate genes are those with consistent evidence across pairs after Fisher-combining z-scores.
# The multilevel-modeling step was already run as part of test_celltype_pairs(adata).
# The aggregated per-gene results live on adata.uns['dialogue']:
adata.uns["dialogue"]["gene_pvalues"]["TA2"].head()
| program | gene | up | programF | CD8+ IELs | CD8+ LP | Macrophages | p_up | p_down | n_up | nf_up | n_down | nf_down | N | Nf | coef | |
|---|---|---|---|---|---|---|---|---|---|---|---|---|---|---|---|---|
| 0 | MCP1 | RPL39 | True | MCP1.up | 24.754716 | 21.512443 | 22.788105 | 0.000000e+00 | 1.0 | 3 | 1.0 | 3 | 1.0 | 3 | 1.0 | 0.313548 |
| 1 | MCP1 | MT-ND3 | True | MCP1.up | 10.453085 | 10.534360 | 9.848743 | 4.698435e-67 | 1.0 | 3 | 1.0 | 3 | 1.0 | 3 | 1.0 | 0.247751 |
| 2 | MCP1 | UQCRB | True | MCP1.up | 8.354035 | 7.202085 | 9.274277 | 8.884742e-44 | 1.0 | 3 | 1.0 | 3 | 1.0 | 3 | 1.0 | 0.362470 |
| 3 | MCP1 | RPL34 | True | MCP1.up | 2.894931 | 2.738550 | 3.231622 | 1.219513e-05 | 1.0 | 3 | 1.0 | 3 | 1.0 | 3 | 1.0 | 0.116094 |
| 4 | MCP1 | SLC12A2 | True | MCP1.up | 15.146043 | 11.777727 | 11.653668 | 1.029416e-106 | 1.0 | 3 | 1.0 | 3 | 1.0 | 3 | 1.0 | 0.582585 |
The per-gene Fisher-combined table for each cell type is also exposed:
ta2_genes = dl.get_program_genes(adata, program="MCP1", celltype="TA2")
How much do the two sets overlap on TA2?
sig_genes = extrema_genes["TA2"][extrema_genes["TA2"]["pvals_adj"] < 0.05]
up_genes_extrema = set(sig_genes[sig_genes["logfoldchanges"] > 0]["names"])
down_genes_extrema = set(sig_genes[sig_genes["logfoldchanges"] < 0]["names"])
ta2_up = set(ta2_genes["up"])
overlap = ta2_up & up_genes_extrema
print(f"extrema_up={len(up_genes_extrema)}  dialogue_up={len(ta2_up)}  overlap={len(overlap)}")
extrema_up=736 dialogue_up=79 overlap=79
ta2_down = set(ta2_genes["down"])
overlap_down = ta2_down & down_genes_extrema
print(f"extrema_down={len(down_genes_extrema)}  dialogue_down={len(ta2_down)}  overlap={len(overlap_down)}")
extrema_down=1576 dialogue_down=87 overlap=87