pertpy.tools.Dialogue#
- class Dialogue(*, celltype_key, sample_key, cell_quality_key='cellQ', n_programs=3, feature_space_key='X_pca', n_components=30, n_genes_per_signature=100, anova_alpha=0.05, winsorize_quantile=0.01, n_permutations=100, empirical_alpha=0.1, use_tme_qc=True, additional_covariates=(), min_cells_per_sample=5, random_state=1234)[source]#
Multicellular program discovery (DIALOGUE).
- Parameters:
celltype_key (
str) – Column ofadata.obswith the cell-type assignment.sample_key (
str) – Column ofadata.obswith the sample / niche identifier.cell_quality_key (
str, default:'cellQ') – Column ofadata.obswith the per-cell QC value (typically log-counts) used as a confounder in residualization and in the per-pair HLM (R’scellQ).n_programs (
int, default:3) – Number of multicellular programs to fit (kin the paper).feature_space_key (
str, default:'X_pca') –adata.obsmkey for the pre-computed feature space (typically PCA).n_components (
int, default:30) – Number of components of the feature space to use.n_genes_per_signature (
int, default:100) – Number of top-correlated genes kept per program signature (R’sn.genes).anova_alpha (
float, default:0.05) – Per-feature ANOVA significance threshold for filtering uninformative components (R’sp.anova).winsorize_quantile (
float, default:0.01) – Tail clipping fraction applied to pseudobulk components (R’scap.matparameter).n_permutations (
int, default:100) – Permutations used to derive empirical PMD p-values (R’sn1inDIALOGUE1.PMD.empirical).empirical_alpha (
float, default:0.1) – P-value threshold below which a program is considered shared between a pair of cell types (R’s implicit< 0.1).use_tme_qc (
bool, default:True) – If True, addtme_qc(partner-celltype per-sample average ofcell_quality_key) as an additional HLM covariate (R default).additional_covariates (
Sequence[str], default:()) – Extraadata.obscolumns to include as HLM covariates.min_cells_per_sample (
int, default:5) – Minimum cells per sample required for a cell type to be considered in the pair-level HLM (R’sabn.c).random_state (
int, default:1234) – Reproducibility seed for permutation tests and PMD permute search.
Methods table#
|
Differential-expression scan between the highest- and lowest-scoring cells per cell type for one program. |
|
Identify multicellular programs across cell types via penalized multiple-CCA. |
|
Return the refined gene signature |
|
Cross-celltype pairplot of sample-level program scores, colored by a phenotype. |
|
Per-celltype split violin of program scores stratified by a binary phenotype. |
|
Aggregate per-pair HLM evidence and fit final per-cell program scores via iterative non-negative least squares. |
|
For every ordered pair of cell types, fit a hierarchical linear model of one cell type's program score against the partner cell type's pseudobulk expression of candidate genes. |
|
Test each program's association with a binary phenotype using per-celltype hierarchical models. |
Methods#
- Dialogue.find_extreme_score_genes(adata, *, program='MCP1', fraction=0.1)[source]#
Differential-expression scan between the highest- and lowest-scoring cells per cell type for one program.
- Parameters:
adata (
AnnData) – AnnData afterrefine_scores().program (
str, default:'MCP1') – Program to use ("MCP1"by default).fraction (
float, default:0.1) – Fraction of cells at each tail to compare. Must lie in(0, 0.5).
- Return type:
Examples
>>> import pertpy as pt
>>> import scanpy as sc
>>> adata = pt.dt.dialogue_example()
>>> sc.pp.pca(adata)
>>> dl = pt.tl.Dialogue(celltype_key="cell.subtypes", sample_key="sample", n_programs=3)
>>> dl.fit_programs(adata)
>>> dl.test_celltype_pairs(adata)
>>> dl.refine_scores(adata)
>>> dl.find_extreme_score_genes(adata, program="MCP1", fraction=0.1)
- Dialogue.fit_programs(adata)[source]#
Identify multicellular programs across cell types via penalized multiple-CCA.
Phase 1 of DIALOGUE. Pseudobulks each cell type per sample, filters uninformative components by ANOVA, centers and winsorizes them, then runs penalized multiple-CCA on the cell types’ pseudobulk feature spaces to obtain weights and per-cell program scores. Empirical p-values for each program-by-pair are computed by repeating the PMD on permuted matrices.
Stores the following on
adata:adata.obsm["X_dialogue_cca"]— per-cell CCA scores (n_obs × n_programs), residualized on the cell-quality confounder, NaN-padded for cells of cell types skipped during fitting.adata.uns["dialogue"]["weights"][celltype]— PMD weights (n_components × n_programs).adata.uns["dialogue"]["pseudobulk_features"][celltype]— the post-filter, post-center pseudobulk matrices (samples × retained components).adata.uns["dialogue"]["empirical_pvalues"]— programs × cell-type pairs.adata.uns["dialogue"]["cca_correlations_R"]/"_P"— per-pair pairwise correlation and p-value of the cell types’ CCA scores.adata.uns["dialogue"]["program_celltypes"]— mapping of each program to the cell types whose pair passedempirical_alpha.adata.uns["dialogue"]["program_signatures"][program][celltype]— initial signature genes from partial Spearman correlation of CCA scores against the cell type’s expression matrix.adata.uns["dialogue"]["params"]— recorded hyperparameters.adata.uns["dialogue"]["shared_samples"]— samples present in all cell types.adata.uns["dialogue"]["cell_type_order"]— cell types fit (in stable order).
Examples
>>> import pertpy as pt
>>> import scanpy as sc
>>> adata = pt.dt.dialogue_example()
>>> sc.pp.pca(adata)
>>> dl = pt.tl.Dialogue(celltype_key="cell.subtypes", sample_key="sample", n_programs=3)
>>> dl.fit_programs(adata)
- Return type:
- Dialogue.get_program_genes(adata, *, program, celltype=None, strict=False)[source]#
Return the refined gene signature
{"up": [...], "down": [...]}for a program.- Parameters:
adata (
AnnData) – AnnData afterrefine_scores().program (
str) – Program label (e.g."MCP1").celltype (
str|None, default:None) – If given, return only that cell type’s signature. Otherwise return the cross-celltype intersection of consistently up/down genes.strict (
bool, default:False) – Use the strict variant fromprogram_gene_signatures_strict(genes flagged in every pair).
- Return type:
Examples
>>> import pertpy as pt
>>> import scanpy as sc
>>> adata = pt.dt.dialogue_example()
>>> sc.pp.pca(adata)
>>> dl = pt.tl.Dialogue(celltype_key="cell.subtypes", sample_key="sample", n_programs=3)
>>> dl.fit_programs(adata)
>>> dl.test_celltype_pairs(adata)
>>> dl.refine_scores(adata)
>>> dl.get_program_genes(adata, program="MCP1", celltype="CD8+ IELs")
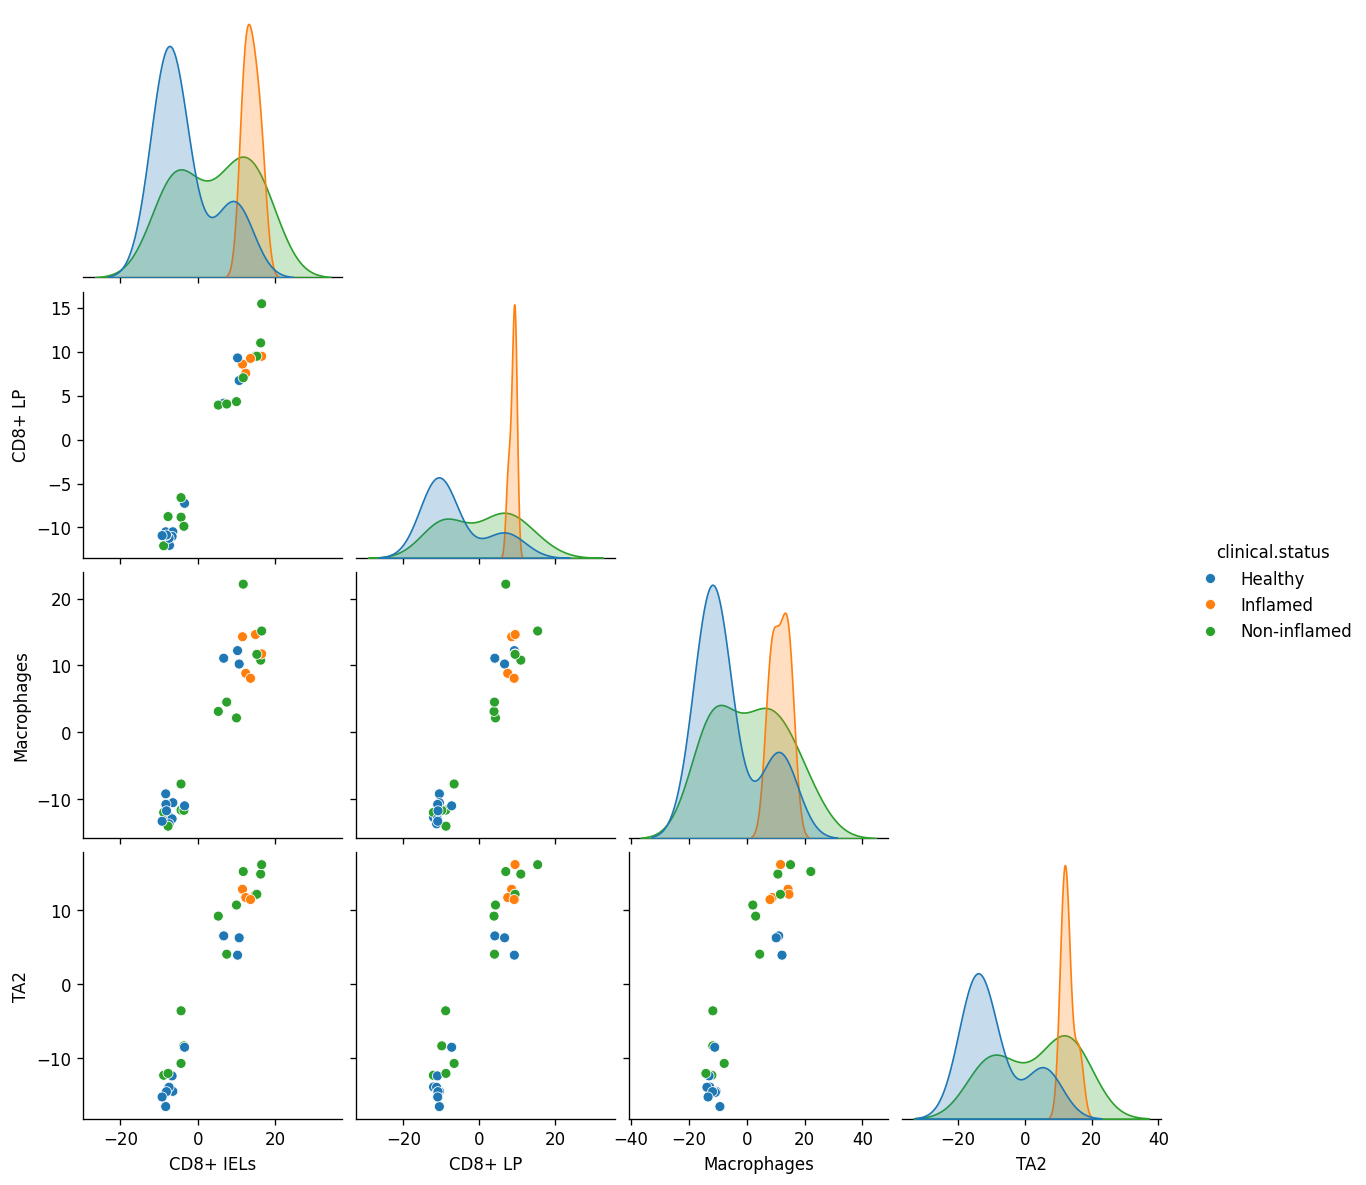
- Dialogue.plot_pairplot(adata, *, color, program='MCP1', return_fig=False)[source]#
Cross-celltype pairplot of sample-level program scores, colored by a phenotype.
Aggregates each (sample, cell type) to the mean program score, pivots into a sample-by-celltype matrix, and runs
seaborn.pairplotwith the sample-levelcolorannotation as the hue.- Parameters:
adata (
AnnData) – AnnData processed byrefine_scores().color (
str) – Column ofadata.obswith the per-sample annotation used as the pairplot hue.program (
str, default:'MCP1') – Program label.return_fig (
bool, default:False) – if True, returns figure of the plot, that can be used for saving.
- Return type:
- Returns:
If
return_figisTrue, returns the figure, otherwiseNone.
Examples
>>> import pertpy as pt
>>> adata = pt.dt.dialogue_example()
>>> dl = pt.tl.Dialogue(celltype_key="cell.subtypes", sample_key="sample", n_programs=3)
>>> dl.fit_programs(adata)
>>> dl.test_celltype_pairs(adata)
>>> dl.refine_scores(adata)
>>> dl.plot_pairplot(adata, color="clinical.status", program="MCP1")
- Preview:
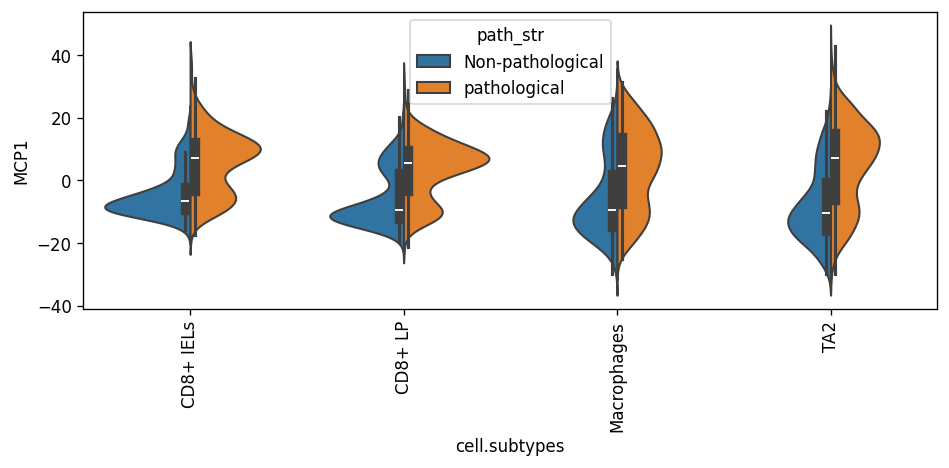
- Dialogue.plot_split_violins(adata, *, condition_key, program='MCP1', conditions=None, return_fig=False)[source]#
Per-celltype split violin of program scores stratified by a binary phenotype.
- Parameters:
adata (
AnnData) – AnnData processed byrefine_scores().condition_key (
str) – Column ofadata.obswith the binary phenotype to split on.program (
str, default:'MCP1') – Program label ("MCP1","MCP2", …).conditions (
tuple[str,str] |None, default:None) – Pick which two values ofadata.obs[condition_key]to plot. Required when the column has more than two levels.return_fig (
bool, default:False) – if True, returns figure of the plot, that can be used for saving.
- Return type:
- Returns:
If
return_figisTrue, returns the figure, otherwiseNone.
Examples
>>> import pertpy as pt
>>> adata = pt.dt.dialogue_example()
>>> dl = pt.tl.Dialogue(celltype_key="cell.subtypes", sample_key="sample", n_programs=3)
>>> dl.fit_programs(adata)
>>> dl.test_celltype_pairs(adata)
>>> dl.refine_scores(adata)
>>> dl.plot_split_violins(adata, condition_key="path_str", program="MCP1")
- Preview:
- Dialogue.refine_scores(adata)[source]#
Aggregate per-pair HLM evidence and fit final per-cell program scores via iterative non-negative least squares.
Phase 3 of DIALOGUE. For every cell type, gather the per-gene z-scores produced by
test_celltype_pairs()across every pair the cell type appears in, BH-adjust within each program-by-direction, Fisher-combine across pairs, then run iterative NNLS to fit per-cell program scores against the resulting candidate gene set (sign-flipping down-regulated columns). The fitted scores are residualized on the cell-quality confounder and written back toadata.obsm["X_dialogue"].Stores on
adata.uns["dialogue"]:gene_pvalues[celltype]— combined gene table with per-pair z-scores, Fisher-combinedp_up/p_down, support countsn_up/n_down, fractionsnf_up/nf_down, program label,updirection, and the fittedcoeffrom NNLS.program_gene_signatures[program][celltype] = {"up": [...], "down": [...]}— refined gene signatures (R’ssig1fromDLG.find.scoring).program_gene_signatures_strict[program][celltype] = {"up": [...], "down": [...]}— stricter set (R’ssig2).pair_refined_correlations[pair][program]— per-pair sample-average correlation R of the refined scores plus the HLM p-value for the same pair.
Updates
adata.obsm["X_dialogue"]with the refined per-cell program scores.Examples
>>> import pertpy as pt
>>> import scanpy as sc
>>> adata = pt.dt.dialogue_example()
>>> sc.pp.pca(adata)
>>> dl = pt.tl.Dialogue(celltype_key="cell.subtypes", sample_key="sample", n_programs=3)
>>> dl.fit_programs(adata)
>>> dl.test_celltype_pairs(adata)
>>> dl.refine_scores(adata)
- Return type:
- Dialogue.test_celltype_pairs(adata, *, show_progress=False)[source]#
For every ordered pair of cell types, fit a hierarchical linear model of one cell type’s program score against the partner cell type’s pseudobulk expression of candidate genes.
Phase 2 of DIALOGUE. Builds per-pair, per-program tables of (estimate, pvalue, z-score) for each candidate gene from
fit_programs’ signatures and prunes them to the topn_genes_per_signatureper direction. Pair-level “shared abundant” samples are those with at leastmin_cells_per_samplecells in both cell types of the pair.Stores on
adata.uns["dialogue"]["pair_results"]a nested dict.pair_results[pair_name][program][celltype]is a DataFrame with one row per gene tested (in that cell type’s signature) and columnsestimate, pvalue, zscore, up. Refined per-pair signatures live atpair_results[pair_name][program]["refined_signatures"][celltype] = {"up": [...], "down": [...]}.- Parameters:
adata (
AnnData) – AnnData previously processed byfit_programs().show_progress (
bool, default:False) – If True, print one line per pair while running.
- Return type:
Examples
>>> import pertpy as pt
>>> import scanpy as sc
>>> adata = pt.dt.dialogue_example()
>>> sc.pp.pca(adata)
>>> dl = pt.tl.Dialogue(celltype_key="cell.subtypes", sample_key="sample", n_programs=3)
>>> dl.fit_programs(adata)
>>> dl.test_celltype_pairs(adata)
- Dialogue.test_phenotype_association(adata, condition_key, *, conditions=None)[source]#
Test each program’s association with a binary phenotype using per-celltype hierarchical models.
For every (program, cell type), fits
score ~ phenotype + cell_quality + (1 | sample)on the cells of that cell type, wherephenotypeis a binary indicator coded fromadata.obs[condition_key]. Returns a DataFrame of signed z-scores (rows = cell types, columns = programs) plus a Fisher-combined p-value column across cell types per program.- Parameters:
adata (
AnnData) – AnnData afterrefine_scores().condition_key (
str) – Column ofadata.obswith the phenotype labels (categorical with exactly two levels, or passconditionsto pick which two to compare).conditions (
tuple[str,str] |None, default:None) – Optional two-element tuple selecting which two values ofadata.obs[condition_key]are compared.
- Returns:
cell types, columns: programs). The combined p-values are stored on
adata.uns["dialogue"]["phenotype_pvalues"].- Return type:
Examples
>>> import pertpy as pt
>>> import scanpy as sc
>>> adata = pt.dt.dialogue_example()
>>> sc.pp.pca(adata)
>>> dl = pt.tl.Dialogue(celltype_key="cell.subtypes", sample_key="sample", n_programs=3)
>>> dl.fit_programs(adata)
>>> dl.test_celltype_pairs(adata)
>>> dl.refine_scores(adata)
>>> dl.test_phenotype_association(adata, condition_key="path_str")