pertpy.tools.Augur#
- class Augur(estimator, n_estimators=100, max_depth=None, max_features=2, penalty='l2', random_state=None)[source]#
Python implementation of Augur.
Methods table#
|
Calculate average metric of cross validation runs done of one cell type. |
|
Implementation of Lin's Concordance correlation coefficient, based on -/snippets/1730605. |
|
Cox compare test on two models. |
|
Creates a model object of the provided type and populates it with desired parameters. |
|
Cross validate subsample anndata object. |
|
Subsample and select random features of anndata object. |
|
Loads the input data. |
|
Plot scatterplot of differential prioritization. |
|
Plot a lollipop plot of the n features with largest feature importances. |
|
Plot a lollipop plot of the mean augur values. |
|
Create scatterplot with two augur results. |
|
Calculates the Area under the Curve using the given classifier. |
|
Predicts the differential prioritization by performing permutation tests on samples. |
|
Perform cross validation on given subsample. |
|
Sample AnnData observations. |
|
Feature selection by variance using scanpy highly variable genes function. |
|
Feature selection based on Augur implementation. |
|
Set scoring fuctions for cross-validation based on estimator. |
Methods#
- Augur.average_metrics(cell_cv_results)[source]#
Calculate average metric of cross validation runs done of one cell type.
- Augur.ccc_score(y_true, y_pred)[source]#
Implementation of Lin’s Concordance correlation coefficient, based on -/snippets/1730605.
- Augur.cox_compare(loess1, loess2)[source]#
Cox compare test on two models.
Based on: https://www.statsmodels.org/dev/generated/statsmodels.stats.diagnostic.compare_cox.html Info: Tests of non-nested hypothesis might not provide unambiguous answers. The test should be performed in both directions and it is possible that both or neither test rejects.
- Parameters:
loess1 – fitted loess regression object
loess2 – fitted loess regression object
- Returns:
t-statistic for the test that including the fitted values of the first model in the second model has no effect and two-sided pvalue for the t-statistic
- Augur.create_estimator(classifier, *, n_estimators=100, max_depth=None, max_features=2, penalty='l2', random_state=None)[source]#
Creates a model object of the provided type and populates it with desired parameters.
- Parameters:
classifier (
Literal['random_forest_classifier','random_forest_regressor','logistic_regression_classifier']) – classifier to use in calculating the area under the curve. Either random forest classifier or logistic regression for categorical data or random forest regressor for continous datan_estimators (
int, default:100) – Number of trees in the forest.max_depth (
int|None, default:None) – Maximal depth of each tree.max_features (
Union[Literal['auto','log2','sqrt'],int,float], default:2) –Maximal number of features considered when looking at best split.
if int then consider max_features for each split
if float consider round(max_features*n_features)
if auto then max_features=n_features (default)
if log2 then max_features=log2(n_features)
if sqrt then max_featuers=sqrt(n_features)
penalty (
Literal['l1','l2','elasticnet','none'], default:'l2') –Norm of the penalty used in logistic regression
if l1 then L1 penalty is added
if l2 then L2 penalty is added (default)
if elasticnet both L1 and L2 penalties are added
if none no penalty is added
random_state (
int|None, default:None) – Random model seed.
- Return type:
RandomForestClassifier|RandomForestRegressor|LogisticRegression
Examples
>>> import pertpy as pt
>>> augur = pt.tl.Augur("random_forest_classifier")
>>> estimator = augur.create_estimator("logistic_regression_classifier")
- Augur.cross_validate_subsample(adata, *, augur_mode, subsample_size, folds, feature_perc, subsample_idx, random_state, zero_division)[source]#
Cross validate subsample anndata object.
- Parameters:
adata (
AnnData) – Anndata with obs label and cell_type for label and cell type and dummie variable y_ columns used as targetaugur_mode (
str) – one of default, velocity or permute. Setting augur_mode = “velocity” disables feature selection, assuming feature selection has been performed by the RNA velocity procedure to produce the input matrix, while setting augur_mode = “permute” will generate a null distribution of AUCs for each cell type by permuting the labelssubsample_size (
int) – number of cells to subsample randomly per type from each experimental conditionfolds (
int) – number of folds to run cross validation onfeature_perc (
float) – proportion of genes that are randomly selected as features for input to the classifier in each subsample using the random gene filtersubsample_idx (
int) – index of the subsamplerandom_state (
int|None) – set numpy random seed, sampling seed and fold seedzero_division (
int|str) – 0 or 1 or warn; Sets the value to return when there is a zero division. If set to “warn”, this acts as 0, but warnings are also raised. Precision metric parameter.
- Return type:
- Returns:
Results for each cross validation fold.
Examples
>>> import pertpy as pt
>>> adata = pt.dt.sc_sim_augur()
>>> ag_rfc = pt.tl.Augur("random_forest_classifier")
>>> loaded_data = ag_rfc.load(adata)
>>> ag_rfc.select_highly_variable(loaded_data)
>>> results = ag_rfc.cross_validate_subsample(loaded_data, augur_mode="default", subsample_size=20,                 folds=3, feature_perc=0.5, subsample_idx=0, random_state=42, zero_division=0)
- Augur.draw_subsample(adata, *, augur_mode, subsample_size, feature_perc, categorical, random_state)[source]#
Subsample and select random features of anndata object.
- Parameters:
adata (
AnnData) – Anndata with obs label and cell_type for label and cell type and dummie variable y_ columns used as targetaugur_mode (
str) – one of default, velocity or permute. Setting augur_mode = “velocity” disables feature selection, assuming feature selection has been performed by the RNA velocity procedure to produce the input matrix, while setting augur_mode = “permute” will generate a null distribution of AUCs for each cell type by permuting the labelssubsample_size (
int) – number of cells to subsample randomly per type from each experimental conditionfeature_perc (
float) – proportion of genes that are randomly selected as features for input to the classifier in each subsample using the random gene filtercategorical (
bool) – True if target values are categoricalrandom_state (
int) – set numpy random seed and sampling seed
- Return type:
- Returns:
Subsample of anndata object of size subsample_size
Examples
>>> import pertpy as pt
>>> adata = pt.dt.sc_sim_augur()
>>> ag_rfc = pt.tl.Augur("random_forest_classifier")
>>> loaded_data = ag_rfc.load(adata)
>>> ag_rfc.select_highly_variable(loaded_data)
>>> subsample = ag_rfc.draw_subsample(adata, augur_mode="default", subsample_size=20, feature_perc=0.5,                 categorical=True, random_state=42)
- Augur.load(input, *, layer=None, meta=None, label_col='label_col', cell_type_col='cell_type_col', condition_label=None, treatment_label=None)[source]#
Loads the input data.
- Parameters:
input (
AnnData|DataFrame) – Anndata or matrix containing gene expression values (genes in rows, cells in columns) and optionally meta data about each cell.layer (
str|None, default:None) – Layer in AnnData to use for expression data. If None, uses .Xmeta (
DataFrame|None, default:None) – Optional Pandas DataFrame containing meta data about each cell.label_col (
str, default:'label_col') – column of the meta DataFrame or the Anndata or matrix containing the condition labels for each cell in the cell-by-gene expression matrixcell_type_col (
str, default:'cell_type_col') – column of the meta DataFrame or the Anndata or matrix containing the cell type labels for each cell in the cell-by-gene expression matrixcondition_label (
str|None, default:None) – in the case of more than two labels, this label is used in the analysistreatment_label (
str|None, default:None) – in the case of more than two labels, this label is used in the analysis
- Return type:
- Returns:
Anndata object containing gene expression values (cells in rows, genes in columns) and cell type, label and y dummy variables as obs
Examples
>>> import pertpy as pt
>>> adata = pt.dt.sc_sim_augur()
>>> ag_rfc = pt.tl.Augur("random_forest_classifier")
>>> augur_adata = ag_rfc.load(adata)
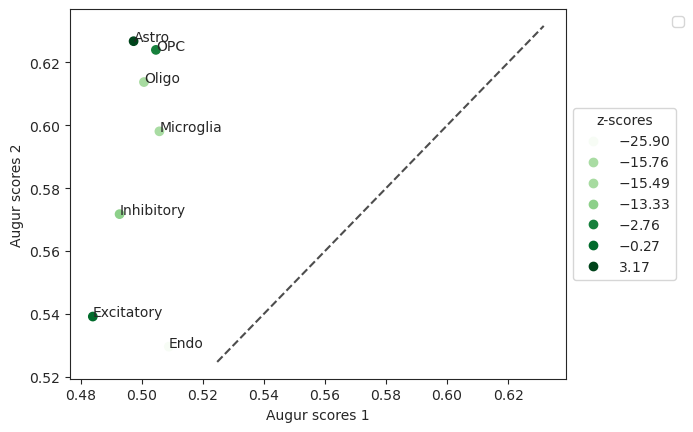
- Augur.plot_dp_scatter(results, *, top_n=None, ax=None, return_fig=False)[source]#
Plot scatterplot of differential prioritization.
- Parameters:
results (
DataFrame) – Results after running differential prioritization.top_n (
int, default:None) – optionally, the number of top prioritized cell types to label in the plotax (
Axes, default:None) – optionally, axes used to draw plotreturn_fig (
bool, default:False) – if True, returns figure of the plot, that can be used for saving.
- Return type:
- Returns:
If return_fig is True, returns the figure, otherwise None.
Examples
>>> import pertpy as pt
>>> adata = pt.dt.bhattacherjee()
>>> ag_rfc = pt.tl.Augur("random_forest_classifier")
>>> data_15 = ag_rfc.load(adata, condition_label="Maintenance_Cocaine", treatment_label="withdraw_15d_Cocaine")
>>> adata_15, results_15 = ag_rfc.predict(data_15, random_state=None, n_threads=4)
>>> adata_15_permute, results_15_permute = ag_rfc.predict(data_15, augur_mode="permute", n_subsamples=100, random_state=None, n_threads=4)
>>> data_48 = ag_rfc.load(adata, condition_label="Maintenance_Cocaine", treatment_label="withdraw_48h_Cocaine")
>>> adata_48, results_48 = ag_rfc.predict(data_48, random_state=None, n_threads=4)
>>> adata_48_permute, results_48_permute = ag_rfc.predict(data_48, augur_mode="permute", n_subsamples=100, random_state=None, n_threads=4)
>>> pvals = ag_rfc.predict_differential_prioritization(augur_results1=results_15, augur_results2=results_48,                 permuted_results1=results_15_permute, permuted_results2=results_48_permute)
>>> ag_rfc.plot_dp_scatter(pvals)
- Preview:
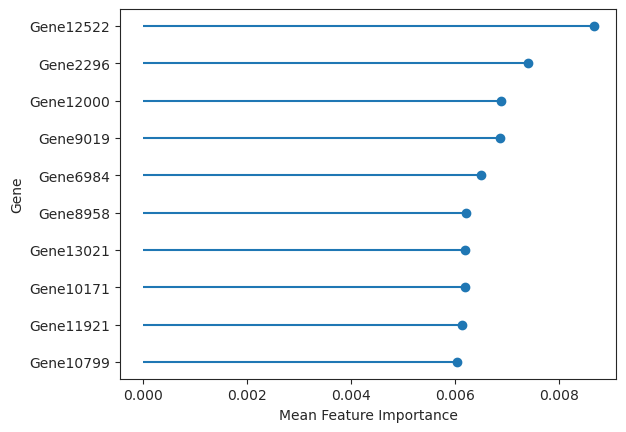
- Augur.plot_important_features(data, *, key='augurpy_results', top_n=10, ax=None, return_fig=False)[source]#
Plot a lollipop plot of the n features with largest feature importances.
- Parameters:
data (
dict[str,Any]) – results after running predict() as dictionary or the AnnData object.key (
str, default:'augurpy_results') – Key in the AnnData object of the resultstop_n (
int, default:10) – n number feature importance values to plot. Default is 10.ax (
Axes, default:None) – optionally, axes used to draw plotreturn_fig (
bool, default:False) – if True, returns figure of the plot, that can be used for saving.
- Return type:
- Returns:
If return_fig is True, returns the figure, otherwise None.
Examples
>>> import pertpy as pt
>>> adata = pt.dt.sc_sim_augur()
>>> ag_rfc = pt.tl.Augur("random_forest_classifier")
>>> loaded_data = ag_rfc.load(adata)
>>> v_adata, v_results = ag_rfc.predict(
...     loaded_data, subsample_size=20, select_variance_features=True, n_threads=4
... )
>>> ag_rfc.plot_important_features(v_results)
- Preview:
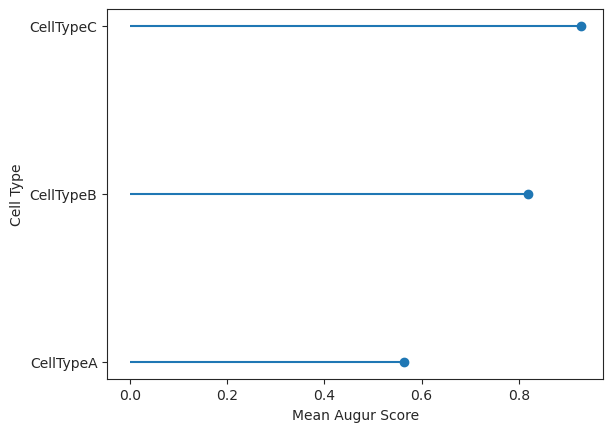
- Augur.plot_lollipop(data, *, key='augurpy_results', ax=None, return_fig=False)[source]#
Plot a lollipop plot of the mean augur values.
- Parameters:
data (
dict[str,Any] |AnnData) – results after running predict() as dictionary or the AnnData object.key (
str, default:'augurpy_results') – .uns key in the results AnnData object.ax (
Axes, default:None) – optionally, axes used to draw plot.return_fig (
bool, default:False) – if True, returns figure of the plot, that can be used for saving.
- Return type:
- Returns:
If return_fig is True, returns the figure, otherwise None.
Examples
>>> import pertpy as pt
>>> adata = pt.dt.sc_sim_augur()
>>> ag_rfc = pt.tl.Augur("random_forest_classifier")
>>> loaded_data = ag_rfc.load(adata)
>>> v_adata, v_results = ag_rfc.predict(
...     loaded_data, subsample_size=20, select_variance_features=True, n_threads=4
... )
>>> ag_rfc.plot_lollipop(v_results)
- Preview:
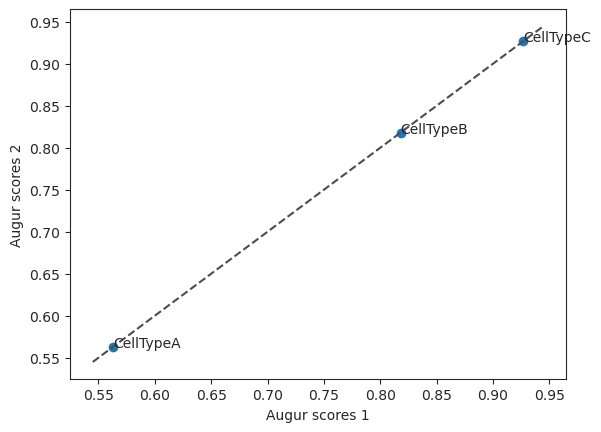
- Augur.plot_scatterplot(results1, results2, *, top_n=None, return_fig=False)[source]#
Create scatterplot with two augur results.
- Parameters:
- Return type:
- Returns:
Axes of the plot.
Examples
>>> import pertpy as pt
>>> adata = pt.dt.sc_sim_augur()
>>> ag_rfc = pt.tl.Augur("random_forest_classifier")
>>> loaded_data = ag_rfc.load(adata)
>>> h_adata, h_results = ag_rfc.predict(loaded_data, subsample_size=20, n_threads=4)
>>> v_adata, v_results = ag_rfc.predict(
...     loaded_data, subsample_size=20, select_variance_features=True, n_threads=4
... )
>>> ag_rfc.plot_scatterplot(v_results, h_results)
- Preview:
- Augur.predict(adata, *, n_subsamples=50, subsample_size=20, folds=3, min_cells=None, feature_perc=0.5, var_quantile=0.5, span=0.75, filter_negative_residuals=False, n_threads=4, augur_mode='default', select_variance_features=True, key_added='augurpy_results', random_state=None, zero_division=0)[source]#
Calculates the Area under the Curve using the given classifier.
- Parameters:
adata (
AnnData) – Anndata with obs label and cell_type for label and cell type and dummie variable y_ columns used as targetn_subsamples (
int, default:50) – number of random subsamples to draw from complete dataset for each cell typesubsample_size (
int, default:20) – number of cells to subsample randomly per type from each experimental conditionfolds (
int, default:3) – number of folds to run cross validation on. Be careful changing this parameter without also changing subsample_size.min_cells (
int, default:None) – minimum number of cells for a particular cell type in each condition in order to retain that type for analysis (depricated..)feature_perc (
float, default:0.5) – proportion of genes that are randomly selected as features for input to the classifier in each subsample using the random gene filtervar_quantile (
float, default:0.5) – The quantile below which features will be filtered, based on their residuals in a loess model.span (
float, default:0.75) – Smoothing factor, as a fraction of the number of points to take into account. Should be in the range (0, 1].filter_negative_residuals (
bool, default:False) – if True, filter residuals at a fixed threshold of zero, instead of var_quantilen_threads (
int, default:4) – number of threads to use for parallelizationselect_variance_features (
bool, default:True) – Whether to select genes based on the original Augur implementation (True) or using scanpy’s highly_variable_genes (False).key_added (
str, default:'augurpy_results') – Key to add results to in .unsaugur_mode (
Literal['default','permute','velocity'], default:'default') – One of ‘default’, ‘velocity’ or ‘permute’. Setting augur_mode = “velocity” disables feature selection, assuming feature selection has been performed by the RNA velocity procedure to produce the input matrix, while setting augur_mode = “permute” will generate a null distribution of AUCs for each cell type by permuting the labels. Note that when setting augur_mode = “permute” n_subsample values less than 100 will be set to 500.random_state (
int|None, default:None) – set numpy random seed, sampling seed and fold seedzero_division (
int|str, default:0) – 0 or 1 or warn; Sets the value to return when there is a zero division. If set to “warn”, this acts as 0, but warnings are also raised. Precision metric parameter.
- Return type:
- Returns:
A tuple with a dictionary containing the following keys with an updated AnnData object with mean_augur_score metrics in obs.
summary_metrics: Pandas Dataframe containing mean metrics for each cell type
feature_importances: Pandas Dataframe containing feature importances of genes across all cross validation runs
full_results: Dict containing merged results of individual cross validation runs for each cell type
[cell_types]: Cross validation runs of the cell type called
Examples
>>> import pertpy as pt
>>> adata = pt.dt.sc_sim_augur()
>>> ag_rfc = pt.tl.Augur("random_forest_classifier")
>>> loaded_data = ag_rfc.load(adata)
>>> h_adata, h_results = ag_rfc.predict(loaded_data, subsample_size=20, n_threads=4)
- Augur.predict_differential_prioritization(augur_results1, augur_results2, permuted_results1, permuted_results2, n_subsamples=50, n_permutations=1000)[source]#
Predicts the differential prioritization by performing permutation tests on samples.
Performs permutation tests that identifies cell types with statistically significant differences in augur_score between two conditions respectively compared to the control.
- Parameters:
augur_results1 (
dict[str,Any]) – Augurpy results from condition 1, obtained from predict()[1]augur_results2 (
dict[str,Any]) – Augurpy results from condition 2, obtained from predict()[1]permuted_results1 (
dict[str,Any]) – permuted Augurpy results from condition 1, obtained from predict() with argument augur_mode=permutepermuted_results2 (
dict[str,Any]) – permuted Augurpy results from condition 2, obtained from predict() with argument augur_mode=permuten_subsamples (
int, default:50) – number of subsamples to pool when calculating the mean augur score for each permutation.n_permutations (
int, default:1000) – the total number of mean augur scores to calculate from a background distribution
- Return type:
- Returns:
Results object containing mean augur scores.
Examples
>>> import pertpy as pt
>>> adata = pt.dt.bhattacherjee()
>>> ag_rfc = pt.tl.Augur("random_forest_classifier")
>>> data_15 = ag_rfc.load(adata, condition_label="Maintenance_Cocaine", treatment_label="withdraw_15d_Cocaine")
>>> adata_15, results_15 = ag_rfc.predict(data_15, random_state=None, n_threads=4)
>>> adata_15_permute, results_15_permute = ag_rfc.predict(data_15, augur_mode="permute", n_subsamples=100, random_state=None, n_threads=4)
>>> data_48 = ag_rfc.load(adata, condition_label="Maintenance_Cocaine", treatment_label="withdraw_48h_Cocaine")
>>> adata_48, results_48 = ag_rfc.predict(data_48, random_state=None, n_threads=4)
>>> adata_48_permute, results_48_permute = ag_rfc.predict(data_48, augur_mode="permute", n_subsamples=100, random_state=None, n_threads=4)
>>> pvals = ag_rfc.predict_differential_prioritization(augur_results1=results_15, augur_results2=results_48, permuted_results1=results_15_permute, permuted_results2=results_48_permute)
- Augur.run_cross_validation(subsample, *, subsample_idx, folds, random_state, zero_division)[source]#
Perform cross validation on given subsample.
- Parameters:
subsample (
AnnData) – subsample of gene expression matrix of size subsample_sizeestimator – classifier object to use in calculating the area under the curve
subsample_idx (
int) – index of subsamplefolds (
int) – number of foldszero_division (
int|str) – 0 or 1 or warn; Sets the value to return when there is a zero division. If set to “warn”, this acts as 0, but warnings are also raised. Precision metric parameter.
- Return type:
- Returns:
Dictionary containing prediction metrics and estimator for each fold.
Examples
>>> import pertpy as pt
>>> adata = pt.dt.sc_sim_augur()
>>> ag_rfc = pt.tl.Augur("random_forest_classifier")
>>> loaded_data = ag_rfc.load(adata)
>>> ag_rfc.select_highly_variable(loaded_data)
>>> subsample = ag_rfc.draw_subsample(adata, augur_mode="default", subsample_size=20, feature_perc=0.5,                 categorical=True, random_state=42)
>>> results = ag_rfc.run_cross_validation(subsample=subsample, folds=3, subsample_idx=0, random_state=42, zero_division=0)
- Augur.sample(adata, categorical, subsample_size, random_state, features)[source]#
Sample AnnData observations.
- Parameters:
adata (
AnnData) – Anndata with obs label and cell_type for label and cell type and dummie variable y_ columns used as targetcategorical (
bool) – True if target values are categoricalsubsample_size (
int) – number of cells to subsample randomly per type from each experimental conditionrandom_state (
int) – set numpy random seed and sampling seedfeatures (
list) – features returned Anndata object
- Returns:
Subsample of AnnData object of size subsample_size with given features
Examples
>>> import pertpy as pt
>>> adata = pt.dt.sc_sim_augur()
>>> ag_rfc = pt.tl.Augur("random_forest_classifier")
>>> loaded_data = ag_rfc.load(adata)
>>> ag_rfc.select_highly_variable(loaded_data)
>>> features = loaded_data.var_names
>>> subsample = ag_rfc.sample(
...     loaded_data, categorical=True, subsample_size=20, random_state=42, features=loaded_data.var_names
... )
- Augur.select_highly_variable(adata)[source]#
Feature selection by variance using scanpy highly variable genes function.
- Parameters:
adata (
AnnData) – Anndata object containing gene expression values (cells in rows, genes in columns)- Return type:
- Results:
Anndata object with highly variable genes added as layer
Examples
>>> import pertpy as pt
>>> adata = pt.dt.sc_sim_augur()
>>> ag_rfc = pt.tl.Augur("random_forest_classifier")
>>> loaded_data = ag_rfc.load(adata)
>>> ag_rfc.select_highly_variable(loaded_data)
- Augur.select_variance(adata, *, var_quantile, filter_negative_residuals, span=0.75)[source]#
Feature selection based on Augur implementation.
- Parameters:
adata (
AnnData) – Anndata objectvar_quantile (
float) – The quantile below which features will be filtered, based on their residuals in a loess model.filter_negative_residuals (
bool) – if True, filter residuals at a fixed threshold of zero, instead of var_quantilespan (
float, default:0.75) – Smoothing factor, as a fraction of the number of points to take into account. Should be in the range (0, 1].
- Returns:
AnnData object with additional select_variance column in var.
Examples
>>> import pertpy as pt
>>> adata = pt.dt.sc_sim_augur()
>>> ag_rfc = pt.tl.Augur("random_forest_classifier")
>>> loaded_data = ag_rfc.load(adata)
>>> ag_rfc.select_variance(loaded_data, var_quantile=0.5, filter_negative_residuals=False, span=0.75)
- Augur.set_scorer(multiclass, zero_division)[source]#
Set scoring fuctions for cross-validation based on estimator.
- Parameters:
- Return type:
- Returns:
Dict linking name to scorer object and string name
Examples
>>> import pertpy as pt
>>> ag_rfc = pt.tl.Augur("random_forest_classifier")
>>> scorer = ag_rfc.set_scorer(True, 0)