pertpy.tools.PyDESeq2#
- class PyDESeq2(adata, design, *, mask=None, layer=None, **kwargs)[source]#
Differential expression test using a PyDESeq2.
Attributes table#
Methods table#
|
Compare between groups in a specified column. |
|
Get a contrast vector representing a specific condition. |
|
Build a simple contrast for pairwise comparisons. |
|
Fit dds model using pydeseq2. |
|
Plot a metric from the results as a bar chart, optionally with additional information about paired samples in a scatter plot. |
|
Plot a matrix of log2 fold changes from the results. |
|
Creates a pairwise expression plot from a Pandas DataFrame or Anndata. |
|
Creates a volcano plot from a pandas DataFrame or Anndata. |
|
Perform a comparison as specified in a contrast vector. |
|
Test against a reduced model. |
Attributes#
- PyDESeq2.data#
Get the data matrix from anndata this object was initalized with (X or layer).
- PyDESeq2.variables#
Get the names of the variables used in the model definition.
Methods#
- classmethod PyDESeq2.compare_groups(adata, column, baseline, groups_to_compare, *, paired_by=None, mask=None, layer=None, fit_kwargs=mappingproxy({}), test_kwargs=mappingproxy({}))#
Compare between groups in a specified column.
- Parameters:
adata (
AnnData) – AnnData object.column (
str) – column in obs that contains the grouping information.baseline (
str) – baseline value (one category from variable).groups_to_compare (
str|Iterable[str]) – One or multiple categories from variable to compare against baseline.paired_by (
str|None, default:None) – Column from obs that contains information about paired sample (e.g. subject_id).mask (
Series|None, default:None) – Subset anndata by a boolean mask stored in this column in .obs before making any tests.layer (
str|None, default:None) – Use this layer instead of .X.fit_kwargs (default:
mappingproxy({})) – Additional fit options.test_kwargs (default:
mappingproxy({})) – Additional test options.
- Returns:
Pandas dataframe with results ordered by significance. If multiple comparisons were performed this is indicated in an additional column.
Examples
>>> # Example with EdgeR
>>> import pertpy as pt
>>> adata = pt.dt.zhang_2021()
>>> adata.layers["counts"] = adata.X.copy()
>>> ps = pt.tl.PseudobulkSpace()
>>> pdata = ps.compute(
...     adata,
...     target_col="Patient",
...     groups_col="Cluster",
...     layer_key="counts",
...     mode="sum",
...     min_cells=10,
...     min_counts=1000,
... )
>>> edgr = pt.tl.EdgeR(pdata, design="~Efficacy+Treatment")
>>> res_df = edgr.compare_groups(pdata, column="Efficacy", baseline="SD", groups_to_compare=["PR", "PD"])
- PyDESeq2.cond(**kwargs)#
Get a contrast vector representing a specific condition.
- Parameters:
**kwargs – column/value pairs.
- Returns:
A contrast vector that aligns to the columns of the design matrix.
- PyDESeq2.contrast(*args, **kwargs)#
Build a simple contrast for pairwise comparisons.
- Parameters:
column – column in adata.obs to test on.
baseline – baseline category (denominator).
group_to_compare – category to compare against baseline (nominator).
- Returns:
Numeric contrast vector.
- PyDESeq2.fit(**kwargs)[source]#
Fit dds model using pydeseq2.
Note: this creates its own AnnData object for downstream processing.
- Parameters:
**kwargs – Keyword arguments specific to DeseqDataSet(), except for n_cpus which will use all available CPUs minus one if the argument is not passed.
- Return type:
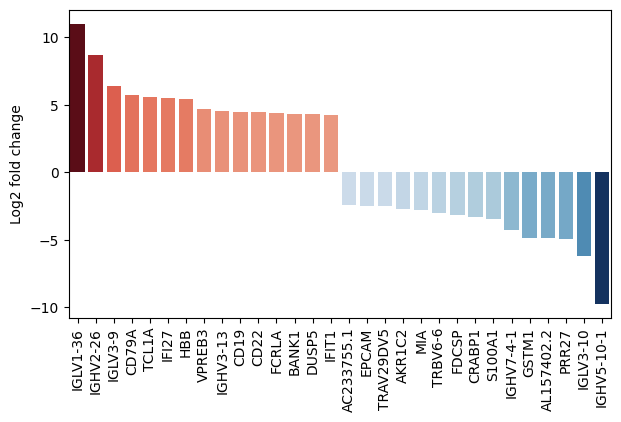
- PyDESeq2.plot_fold_change(results_df, *, var_names=None, n_top_vars=15, log2fc_col='log_fc', symbol_col='variable', y_label='Log2 fold change', figsize=(10, 5), return_fig=False, **barplot_kwargs)#
Plot a metric from the results as a bar chart, optionally with additional information about paired samples in a scatter plot.
- Parameters:
results_df (
DataFrame) – DataFrame with results from DE analysis.var_names (
Sequence[str], default:None) – Variables to plot. If None, the top n_top_vars variables based on the log2 fold change are plotted.n_top_vars (
int, default:15) – Number of top variables to plot. The top and bottom n_top_vars variables are plotted, respectively.log2fc_col (
str, default:'log_fc') – Column name of log2 Fold-Change values.symbol_col (
str, default:'variable') – Column name of gene IDs.y_label (
str, default:'Log2 fold change') – Label for the y-axis.figsize (
tuple[int,int], default:(10, 5)) – Size of the figure.return_fig (
bool, default:False) – if True, returns figure of the plot, that can be used for saving.**barplot_kwargs – Additional arguments for seaborn.barplot.
- Return type:
- Returns:
If return_fig is True, returns the figure, otherwise None.
Examples
>>> # Example with EdgeR
>>> import pertpy as pt
>>> adata = pt.dt.zhang_2021()
>>> adata.layers["counts"] = adata.X.copy()
>>> ps = pt.tl.PseudobulkSpace()
>>> pdata = ps.compute(
...     adata,
...     target_col="Patient",
...     groups_col="Cluster",
...     layer_key="counts",
...     mode="sum",
...     min_cells=10,
...     min_counts=1000,
... )
>>> edgr = pt.tl.EdgeR(pdata, design="~Efficacy+Treatment")
>>> edgr.fit()
>>> res_df = edgr.test_contrasts(
...     edgr.contrast(column="Treatment", baseline="Chemo", group_to_compare="Anti-PD-L1+Chemo")
... )
>>> edgr.plot_fold_change(res_df)
- Preview:
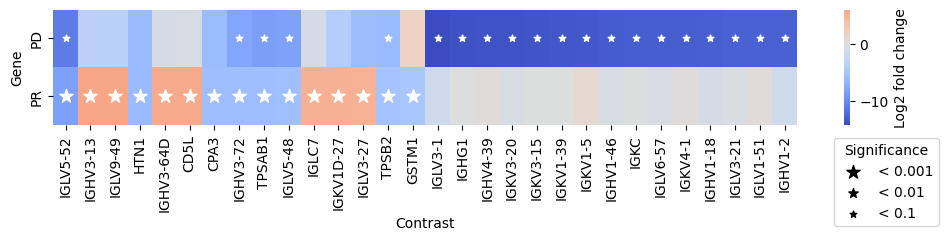
- PyDESeq2.plot_multicomparison_fc(results_df, *, n_top_vars=15, contrast_col='contrast', log2fc_col='log_fc', pvalue_col='adj_p_value', symbol_col='variable', marker_size=100, figsize=(10, 2), x_label='Contrast', y_label='Gene', return_fig=False, **heatmap_kwargs)#
Plot a matrix of log2 fold changes from the results.
- Parameters:
results_df (
DataFrame) – DataFrame with results from DE analysis.n_top_vars (default:
15) – Number of top variables to plot per group.contrast_col (
str, default:'contrast') – Column in results_df containing information about the contrast.log2fc_col (
str, default:'log_fc') – Column in results_df containing the log2 fold change.pvalue_col (
str, default:'adj_p_value') – Column in results_df containing the p-value. Can be used to switch between adjusted and unadjusted p-values.symbol_col (
str, default:'variable') – Column in results_df containing the gene symbol.marker_size (
int, default:100) – Size of the biggest marker for significant variables.figsize (
tuple[int,int], default:(10, 2)) – Size of the figure.x_label (
str, default:'Contrast') – Label for the x-axis.y_label (
str, default:'Gene') – Label for the y-axis.return_fig (
bool, default:False) – if True, returns figure of the plot, that can be used for saving.**heatmap_kwargs – Additional arguments for seaborn.heatmap.
- Return type:
- Returns:
If return_fig is True, returns the figure, otherwise None.
Examples
>>> # Example with EdgeR
>>> import pertpy as pt
>>> adata = pt.dt.zhang_2021()
>>> adata.layers["counts"] = adata.X.copy()
>>> ps = pt.tl.PseudobulkSpace()
>>> pdata = ps.compute(
...     adata,
...     target_col="Patient",
...     groups_col="Cluster",
...     layer_key="counts",
...     mode="sum",
...     min_cells=10,
...     min_counts=1000,
... )
>>> edgr = pt.tl.EdgeR(pdata, design="~Efficacy+Treatment")
>>> res_df = edgr.compare_groups(pdata, column="Efficacy", baseline="SD", groups_to_compare=["PR", "PD"])
>>> edgr.plot_multicomparison_fc(res_df)
- Preview:
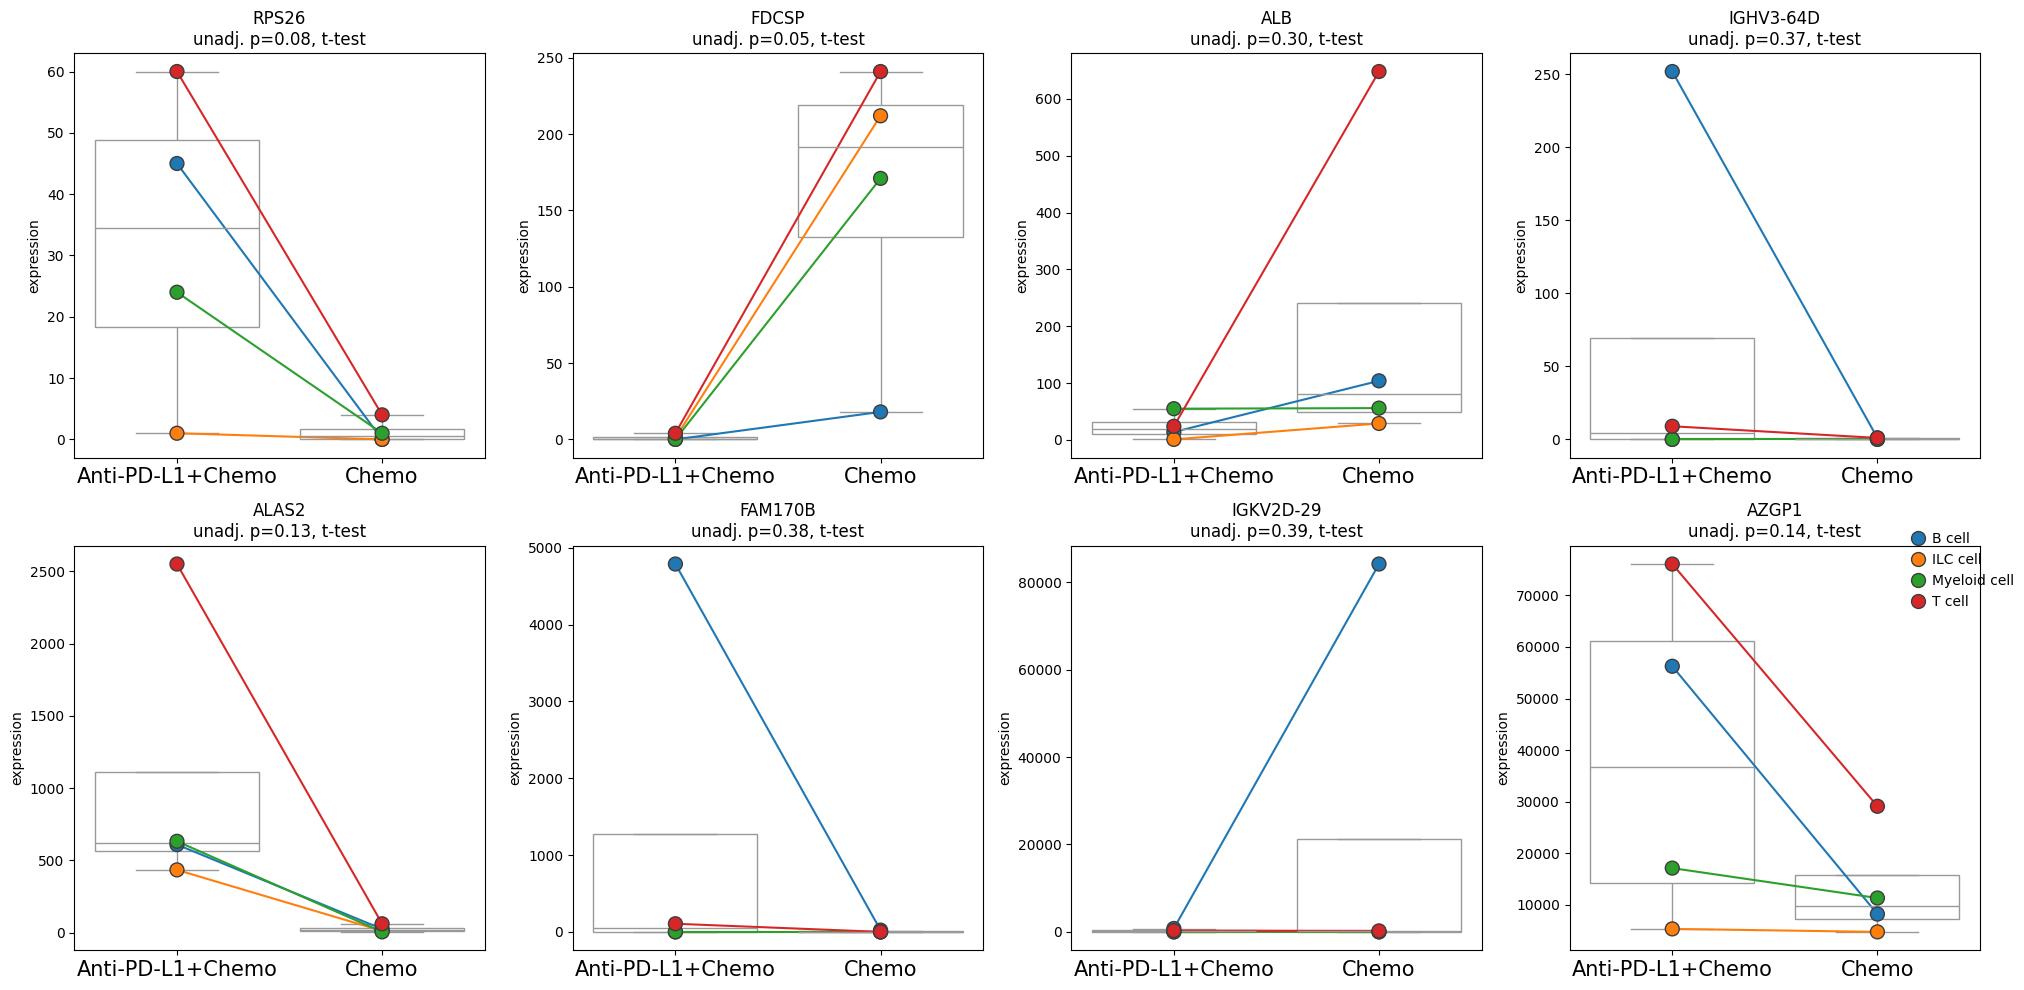
- PyDESeq2.plot_paired(adata, results_df, groupby, pairedby, *, var_names=None, n_top_vars=15, layer=None, pvalue_col='adj_p_value', symbol_col='variable', n_cols=4, panel_size=(5, 5), show_legend=True, size=10, y_label='expression', pvalue_template=<function MethodBase.<lambda>>, boxplot_properties=None, palette=None, return_fig=False)#
Creates a pairwise expression plot from a Pandas DataFrame or Anndata.
Visualizes a panel of paired scatterplots per variable.
- Parameters:
adata (
AnnData) – AnnData object, can be pseudobulked.results_df (
DataFrame) – DataFrame with results from a differential expression test.groupby (
str) – .obs column containing the grouping. Must contain exactly two different values.pairedby (
str) – .obs column containing the pairing (e.g. “patient_id”). If None, an independent t-test is performed.var_names (
Sequence[str], default:None) – Variables to plot.n_top_vars (
int, default:15) – Number of top variables to plot.layer (
str, default:None) – Layer to use for plotting.pvalue_col (
str, default:'adj_p_value') – Column name of the p values.symbol_col (
str, default:'variable') – Column name of gene IDs.n_cols (
int, default:4) – Number of columns in the plot.panel_size (
tuple[int,int], default:(5, 5)) – Size of each panel.show_legend (
bool, default:True) – Whether to show the legend.size (
int, default:10) – Size of the points.y_label (
str, default:'expression') – Label for the y-axis.pvalue_template (default:
<function MethodBase.<lambda> at 0x70675f27f7e0>) – Template for the p-value string displayed in the title of each panel.boxplot_properties (default:
None) – Additional properties for the boxplot, passed to seaborn.boxplot.palette (default:
None) – Color palette for the line- and stripplot.return_fig (
bool, default:False) – if True, returns figure of the plot, that can be used for saving.
- Return type:
- Returns:
If return_fig is True, returns the figure, otherwise None.
Examples
>>> # Example with EdgeR
>>> import pertpy as pt
>>> adata = pt.dt.zhang_2021()
>>> adata.layers["counts"] = adata.X.copy()
>>> ps = pt.tl.PseudobulkSpace()
>>> pdata = ps.compute(
...     adata,
...     target_col="Patient",
...     groups_col="Cluster",
...     layer_key="counts",
...     mode="sum",
...     min_cells=10,
...     min_counts=1000,
... )
>>> edgr = pt.tl.EdgeR(pdata, design="~Efficacy+Treatment")
>>> edgr.fit()
>>> res_df = edgr.test_contrasts(
...     edgr.contrast(column="Treatment", baseline="Chemo", group_to_compare="Anti-PD-L1+Chemo")
... )
>>> edgr.plot_paired(pdata, results_df=res_df, n_top_vars=8, groupby="Treatment", pairedby="Efficacy")
- Preview:
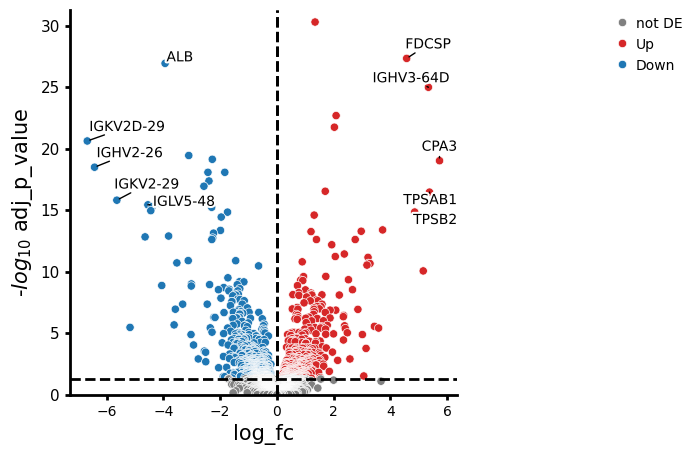
- PyDESeq2.plot_volcano(data, *, log2fc_col='log_fc', pvalue_col='adj_p_value', symbol_col='variable', pval_thresh=0.05, log2fc_thresh=0.75, to_label=5, s_curve=False, colors=None, varm_key=None, color_dict=None, shape_dict=None, size_col=None, fontsize=10, top_right_frame=False, figsize=(5, 5), legend_pos=(1.6, 1), point_sizes=(15, 150), shapes=None, shape_order=None, x_label=None, y_label=None, return_fig=False, **kwargs)#
Creates a volcano plot from a pandas DataFrame or Anndata.
- Parameters:
log2fc_col (
str, default:'log_fc') – Column name of log2 Fold-Change values.pvalue_col (
str, default:'adj_p_value') – Column name of the p values.symbol_col (
str, default:'variable') – Column name of gene IDs.varm_key (
str|None, default:None) – Key in Anndata.varm slot to use for plotting if an Anndata object was passed.size_col (
str|None, default:None) – Column name to size points by.point_sizes (
tuple[int,int], default:(15, 150)) – Lower and upper bounds of point sizes.pval_thresh (
float, default:0.05) – Threshold p value for significance.log2fc_thresh (
float, default:0.75) – Threshold for log2 fold change significance.to_label (
int|list[str], default:5) – Number of top genes or list of genes to label.s_curve (
bool|None, default:False) – Whether to use a reciprocal threshold for up and down gene determination.color_dict (
dict[str,list[str]] |None, default:None) – Dictionary for coloring dots by categories.shape_dict (
dict[str,list[str]] |None, default:None) – Dictionary for shaping dots by categories.fontsize (
int, default:10) – Size of gene labels.colors (
list[str], default:None) – Colors for [non-DE, up, down] genes. Defaults to [‘gray’, ‘#D62728’, ‘#1F77B4’].top_right_frame (
bool, default:False) – Whether to show the top and right frame of the plot.figsize (
tuple[int,int], default:(5, 5)) – Size of the figure.legend_pos (
tuple[float,float], default:(1.6, 1)) – Position of the legend as determined by matplotlib.shapes (
list[str] |None, default:None) – List of matplotlib marker ids.shape_order (
list[str] |None, default:None) – Order of categories for shapes.return_fig (
bool, default:False) – if True, returns figure of the plot, that can be used for saving.**kwargs (
int) – Additional arguments for seaborn.scatterplot.
- Return type:
- Returns:
If return_fig is True, returns the figure, otherwise None.
Examples
>>> # Example with EdgeR
>>> import pertpy as pt
>>> adata = pt.dt.zhang_2021()
>>> adata.layers["counts"] = adata.X.copy()
>>> ps = pt.tl.PseudobulkSpace()
>>> pdata = ps.compute(
...     adata,
...     target_col="Patient",
...     groups_col="Cluster",
...     layer_key="counts",
...     mode="sum",
...     min_cells=10,
...     min_counts=1000,
... )
>>> edgr = pt.tl.EdgeR(pdata, design="~Efficacy+Treatment")
>>> edgr.fit()
>>> res_df = edgr.test_contrasts(
...     edgr.contrast(column="Treatment", baseline="Chemo", group_to_compare="Anti-PD-L1+Chemo")
... )
>>> edgr.plot_volcano(res_df, log2fc_thresh=0)
- Preview:
- PyDESeq2.test_contrasts(contrasts, **kwargs)#
Perform a comparison as specified in a contrast vector.
- PyDESeq2.test_reduced(modelB)#
Test against a reduced model.
- Parameters:
modelB – the reduced model against which to test.
Example
>>> import pertpy as pt
>>> modelA = Model().fit()
>>> modelB = Model().fit()
>>> modelA.test_reduced(modelB)